Plot results#
PyDPF-Post provides functionality for plotting results. Here is a summary of the steps:
Load the
Simulationobject with the result file.Request a
DataFrameobject to obtain the scalar field of interest.Use the plotting methods of the
DataFrameobject to render it.
Some plotting examples follow.
Total deformation#
This code shows how to plot the total deformation (norm of the displacement vector field):
Instantiate the solution object

>>> from ansys.dpf import post
>>> from ansys.dpf.post import examples
>>> simulation = post.load_simulation(examples.download_crankshaft())

Instantiate a dataframe object containing the displacement norm data

>>> displacement_norm = simulation.displacement(norm=True)

Plot the data and save the image

>>> displacement_norm.plot(screenshot="crankshaft_disp.png")
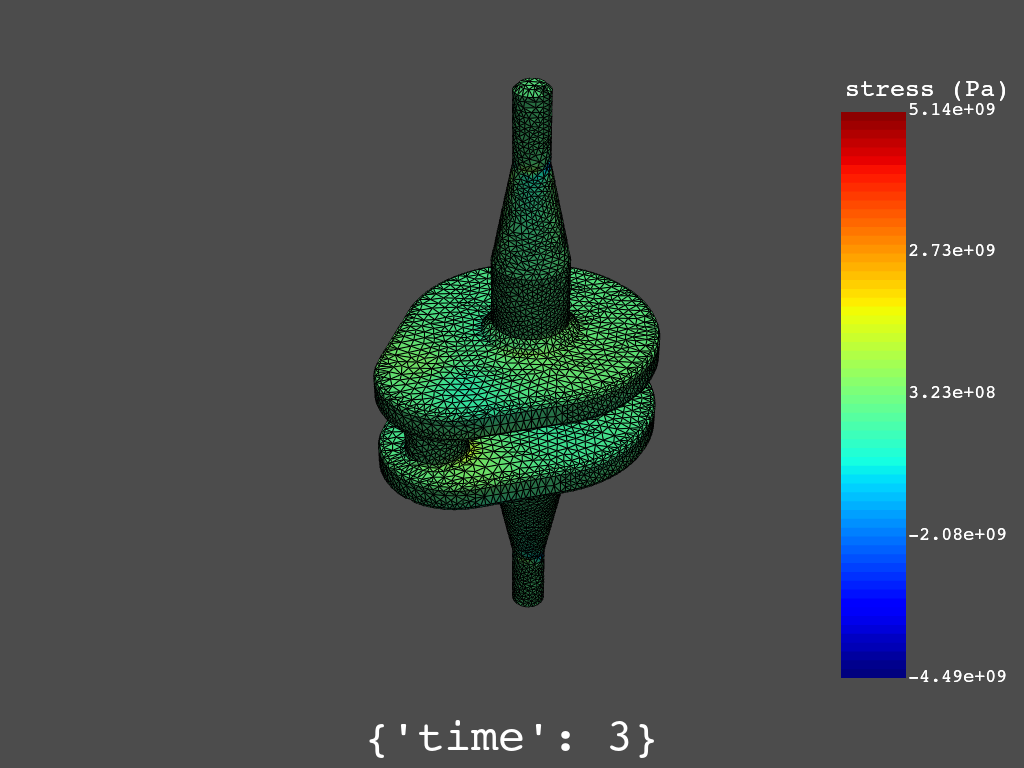
Normal stresses#
Plotting of raw data at Gauss points is not available. However, you can plot data averaged at nodes or elements.
This code shows how to plot the nodal xx-component of stress:
Instantiate the simulation object

>>> from ansys.dpf import post
>>> from ansys.dpf.post import examples
>>> simulation = post.load_simulation(examples.download_crankshaft())

Extract the XX stress data

>>> stress_xx = simulation.stress_nodal(components=["XX"])

Plot the data and save the image

>>> stress_xx.plot(screenshot="crankshaft_stress_xx.png")