Note
Go to the end to download the full example code.
Postprocess a modal mechanical simulation#
This example shows how to postprocess a modal mechanical simulation to view different mode shapes.
Note
This example requires DPF 3.0 (2022 R1) or above. For more information, see PyDPF library compatibilities.
Perform required imports#
Perform required imports. This example uses a supplied file that you can
get by importing the DPF examples package.
from ansys.dpf import post
from ansys.dpf.post import examples
Get Simulation object#
Get the Simulation object that allows access to the result. The Simulation
object must be instantiated with the path for the result file. For example,
"C:/Users/user/my_result.rst" on Windows or "/home/user/my_result.rst"
on Linux.
example_path = examples.download_modal_frame()
# to automatically detect the simulation type, use:
simulation = post.load_simulation(example_path)

# to enable auto-completion, use the equivalent:
simulation = post.ModalMechanicalSimulation(example_path)
View the frequency domain#
To help pick the right modes, printing the time frequency support.
print(simulation.time_freq_support)

# set_ids returns the unique identifiers for the modes
print(simulation.set_ids)
DPF  Time/Freq Support:
  Number of sets: 6
Cumulative     Frequency (Hz) LoadStep       Substep
1              253.615690     1              1
2              317.918491     1              2
3              329.825709     1              3
4              575.619678     1              4
5              621.973976     1              5
6              667.364882     1              6

[1, 2, 3, 4, 5, 6]
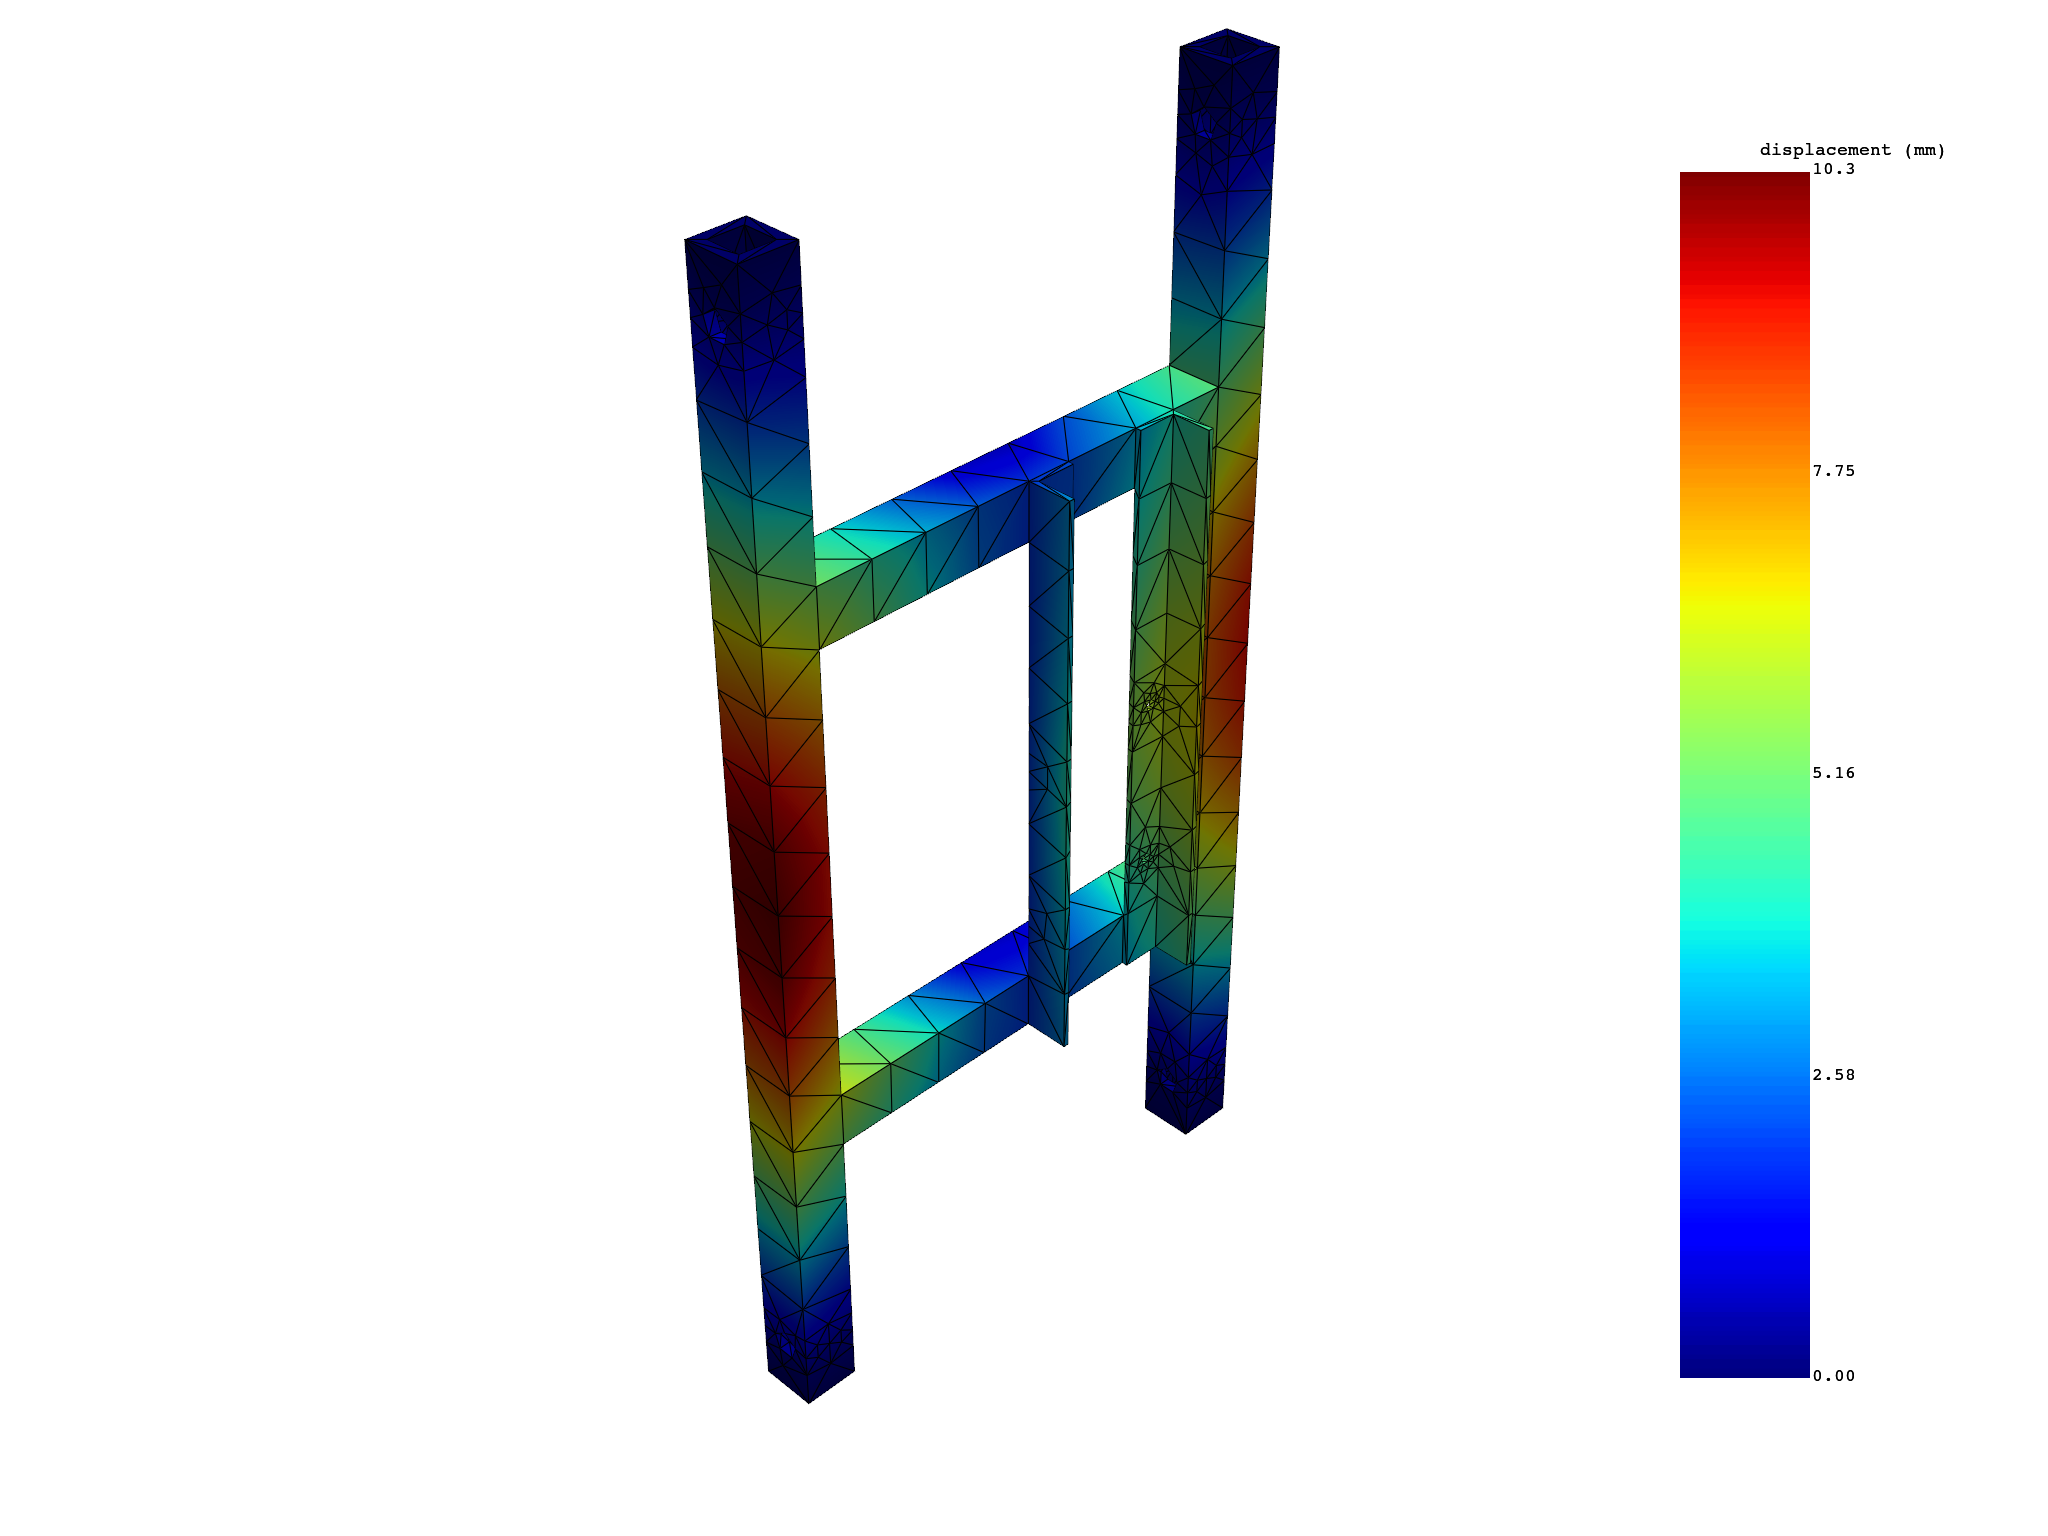
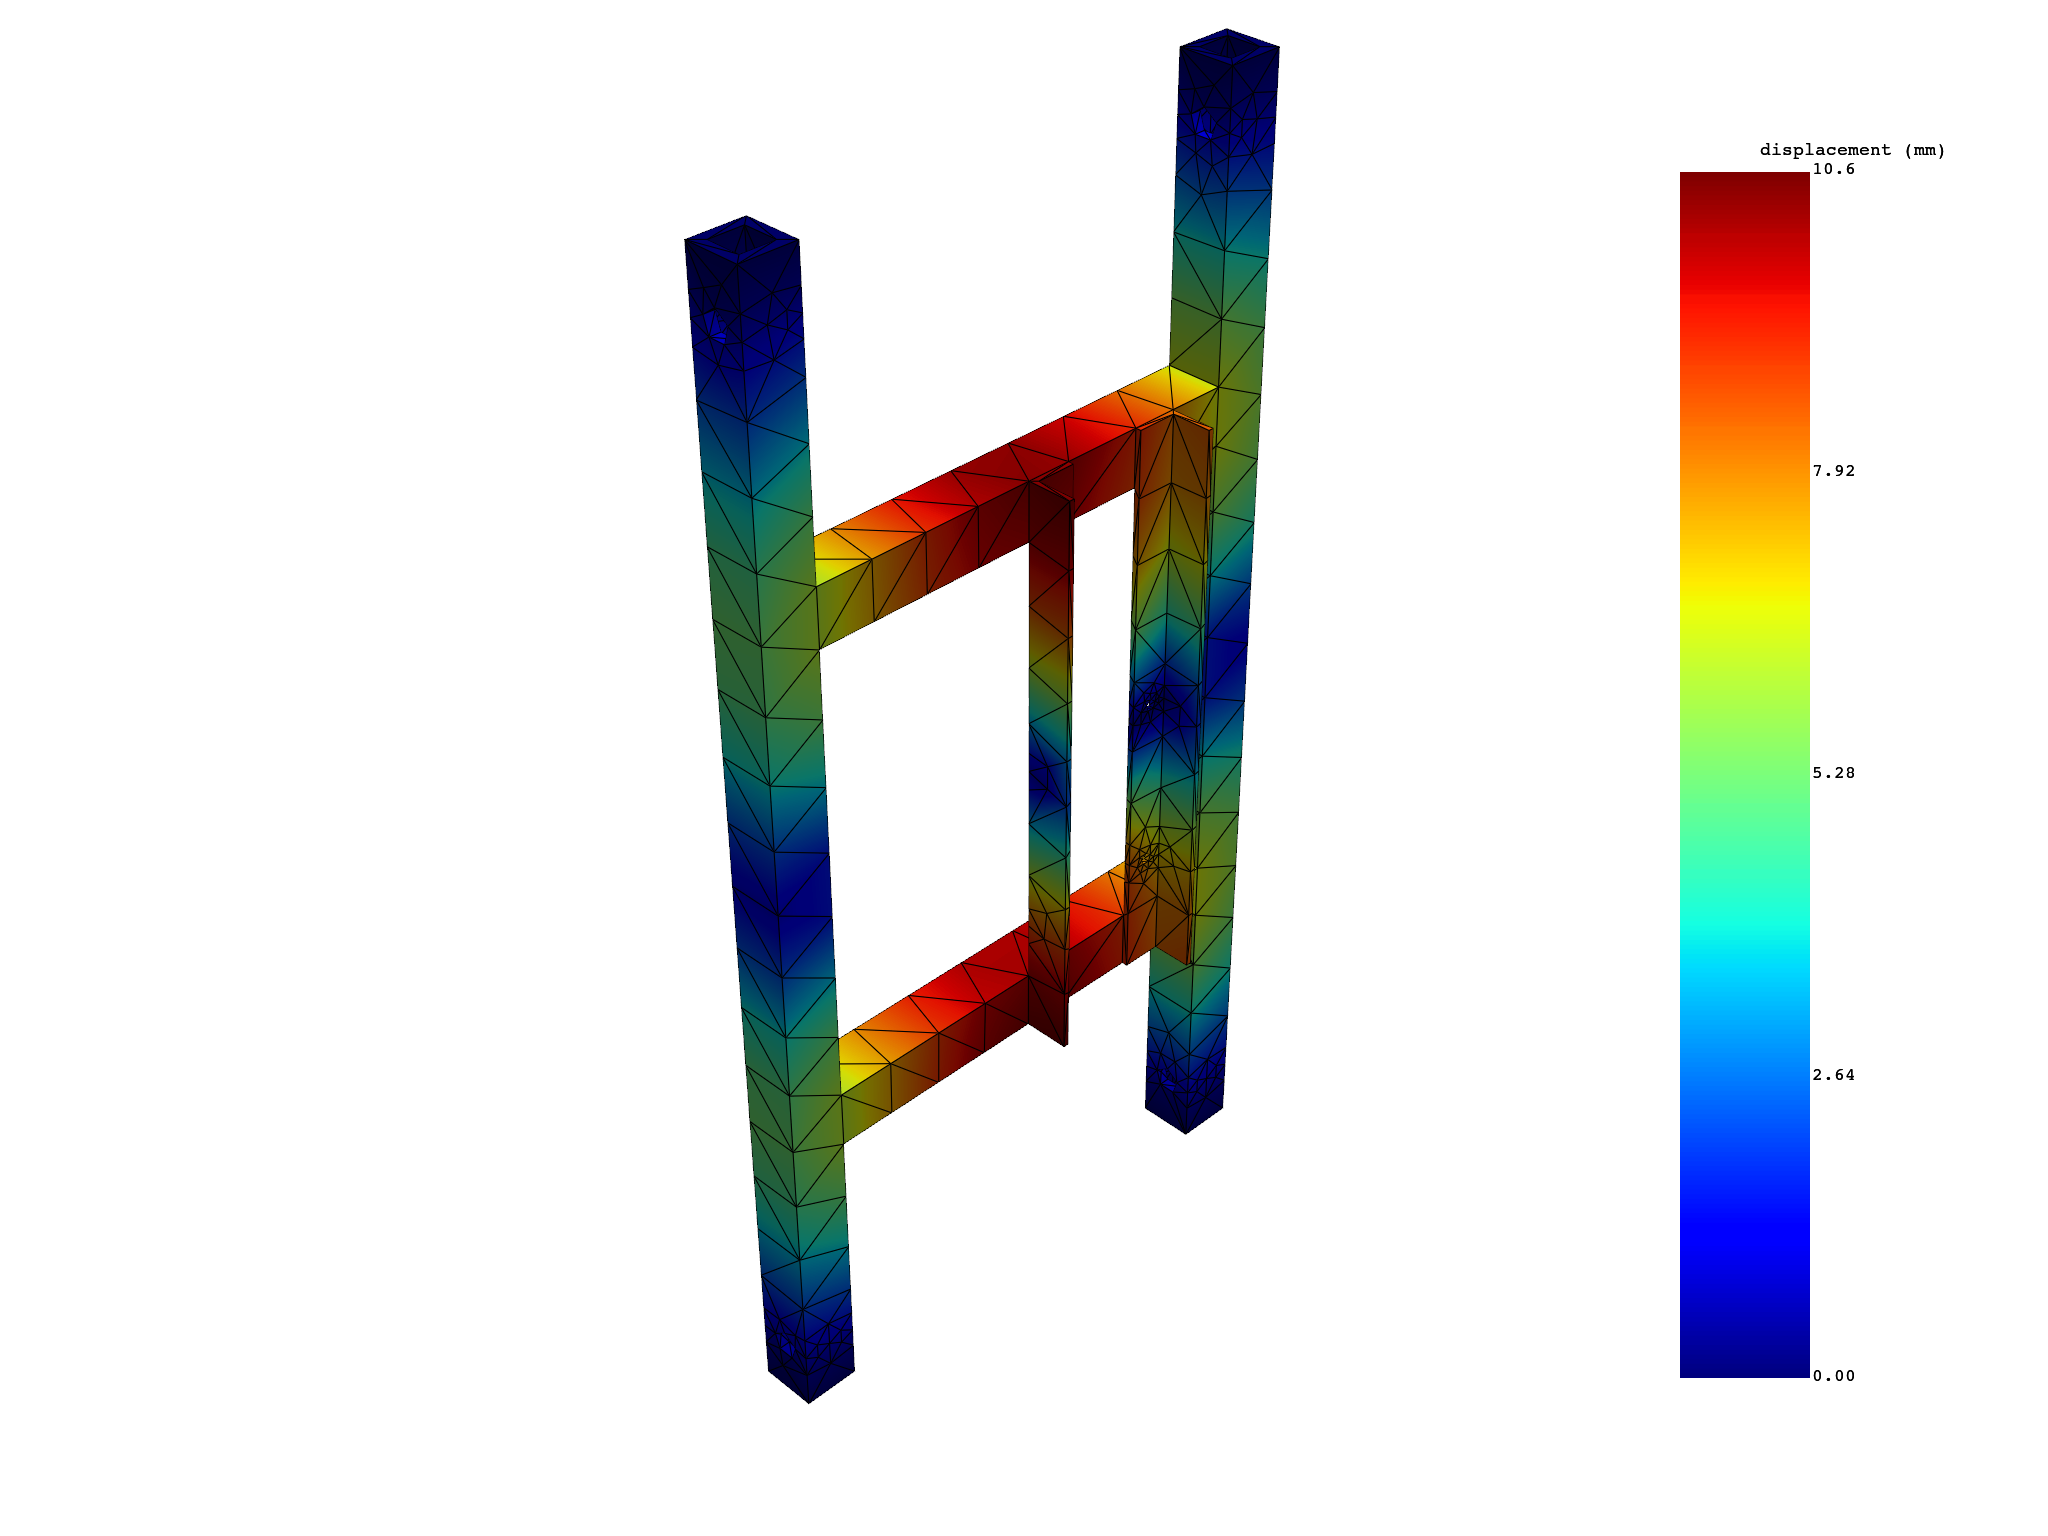
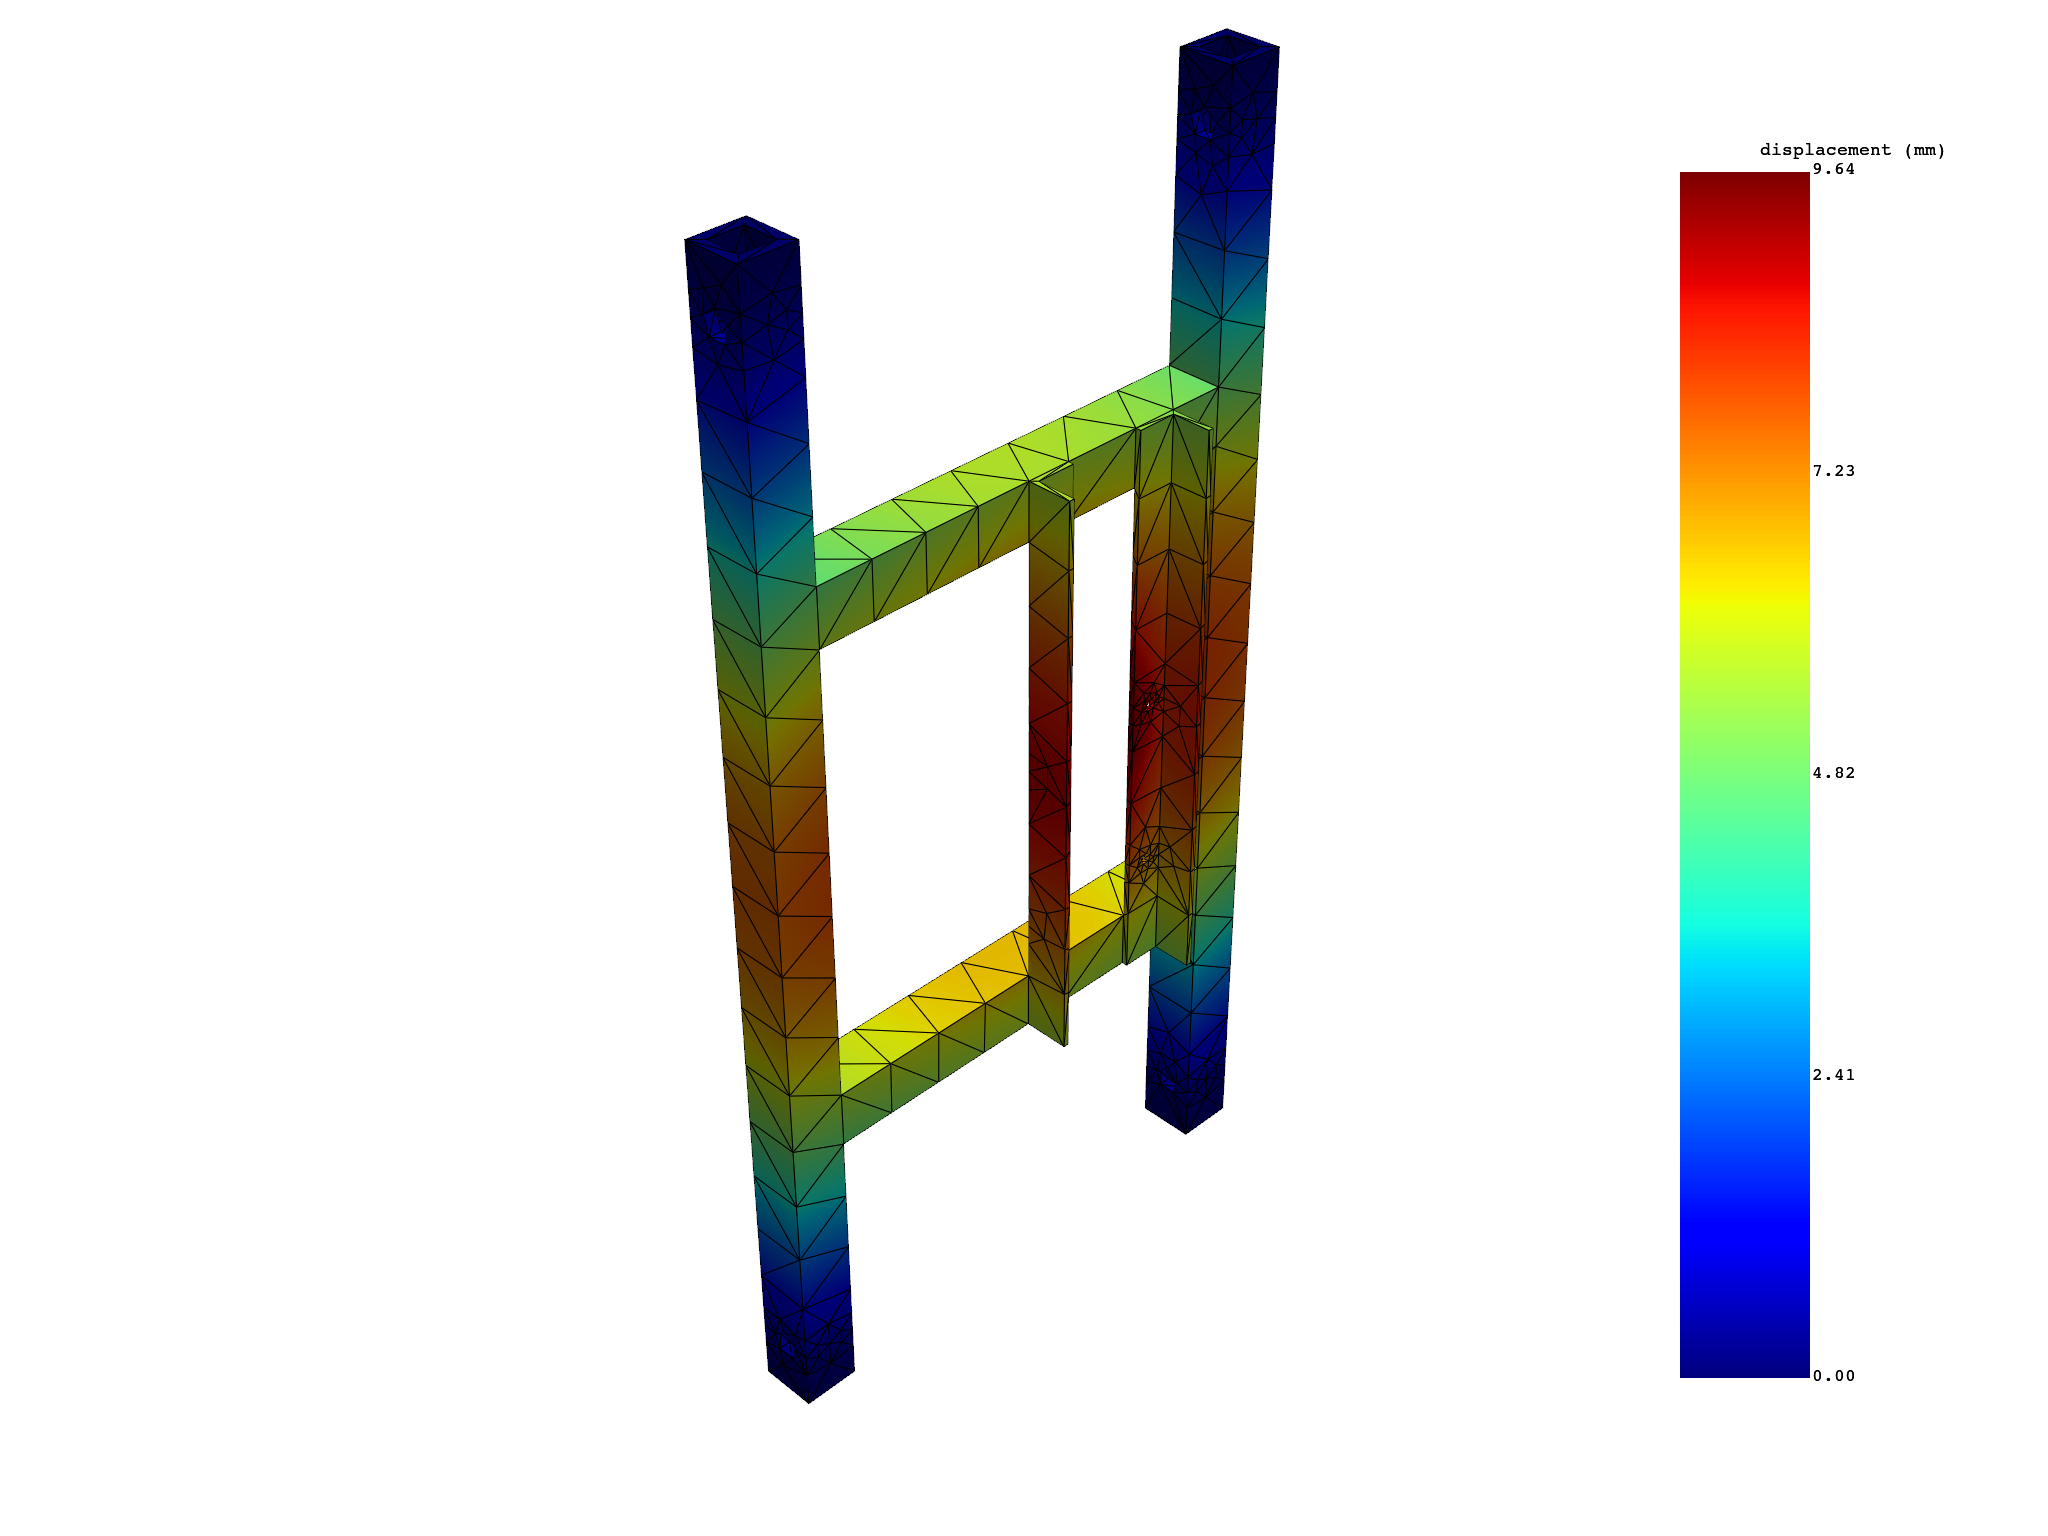
Extract and view all mode shapes#
Extract all mode shapes and view them one by one.


 results   U_N (mm)
 set_ids          1          2          3          4          5          6
node_ids
     367 1.3730e+00 1.8709e+00 2.0199e+00 2.2695e+00 2.9911e+00 1.2970e+00
     509 1.9036e+00 2.5893e+00 2.5942e+00 3.0953e+00 4.0005e+00 1.2648e+00
     428 1.0166e+00 1.4147e+00 1.5069e+00 1.8534e+00 2.3165e+00 7.5843e-01
     510 1.0461e+00 1.4141e+00 1.4841e+00 1.8647e+00 2.2996e+00 8.1520e-01
    3442 1.6226e+00 2.2226e+00 2.2954e+00 2.6685e+00 3.4864e+00 1.2905e+00
    3755 1.4089e+00 1.9743e+00 1.9950e+00 2.4323e+00 3.1554e+00 9.2167e-01
     ...        ...        ...        ...        ...        ...        ...
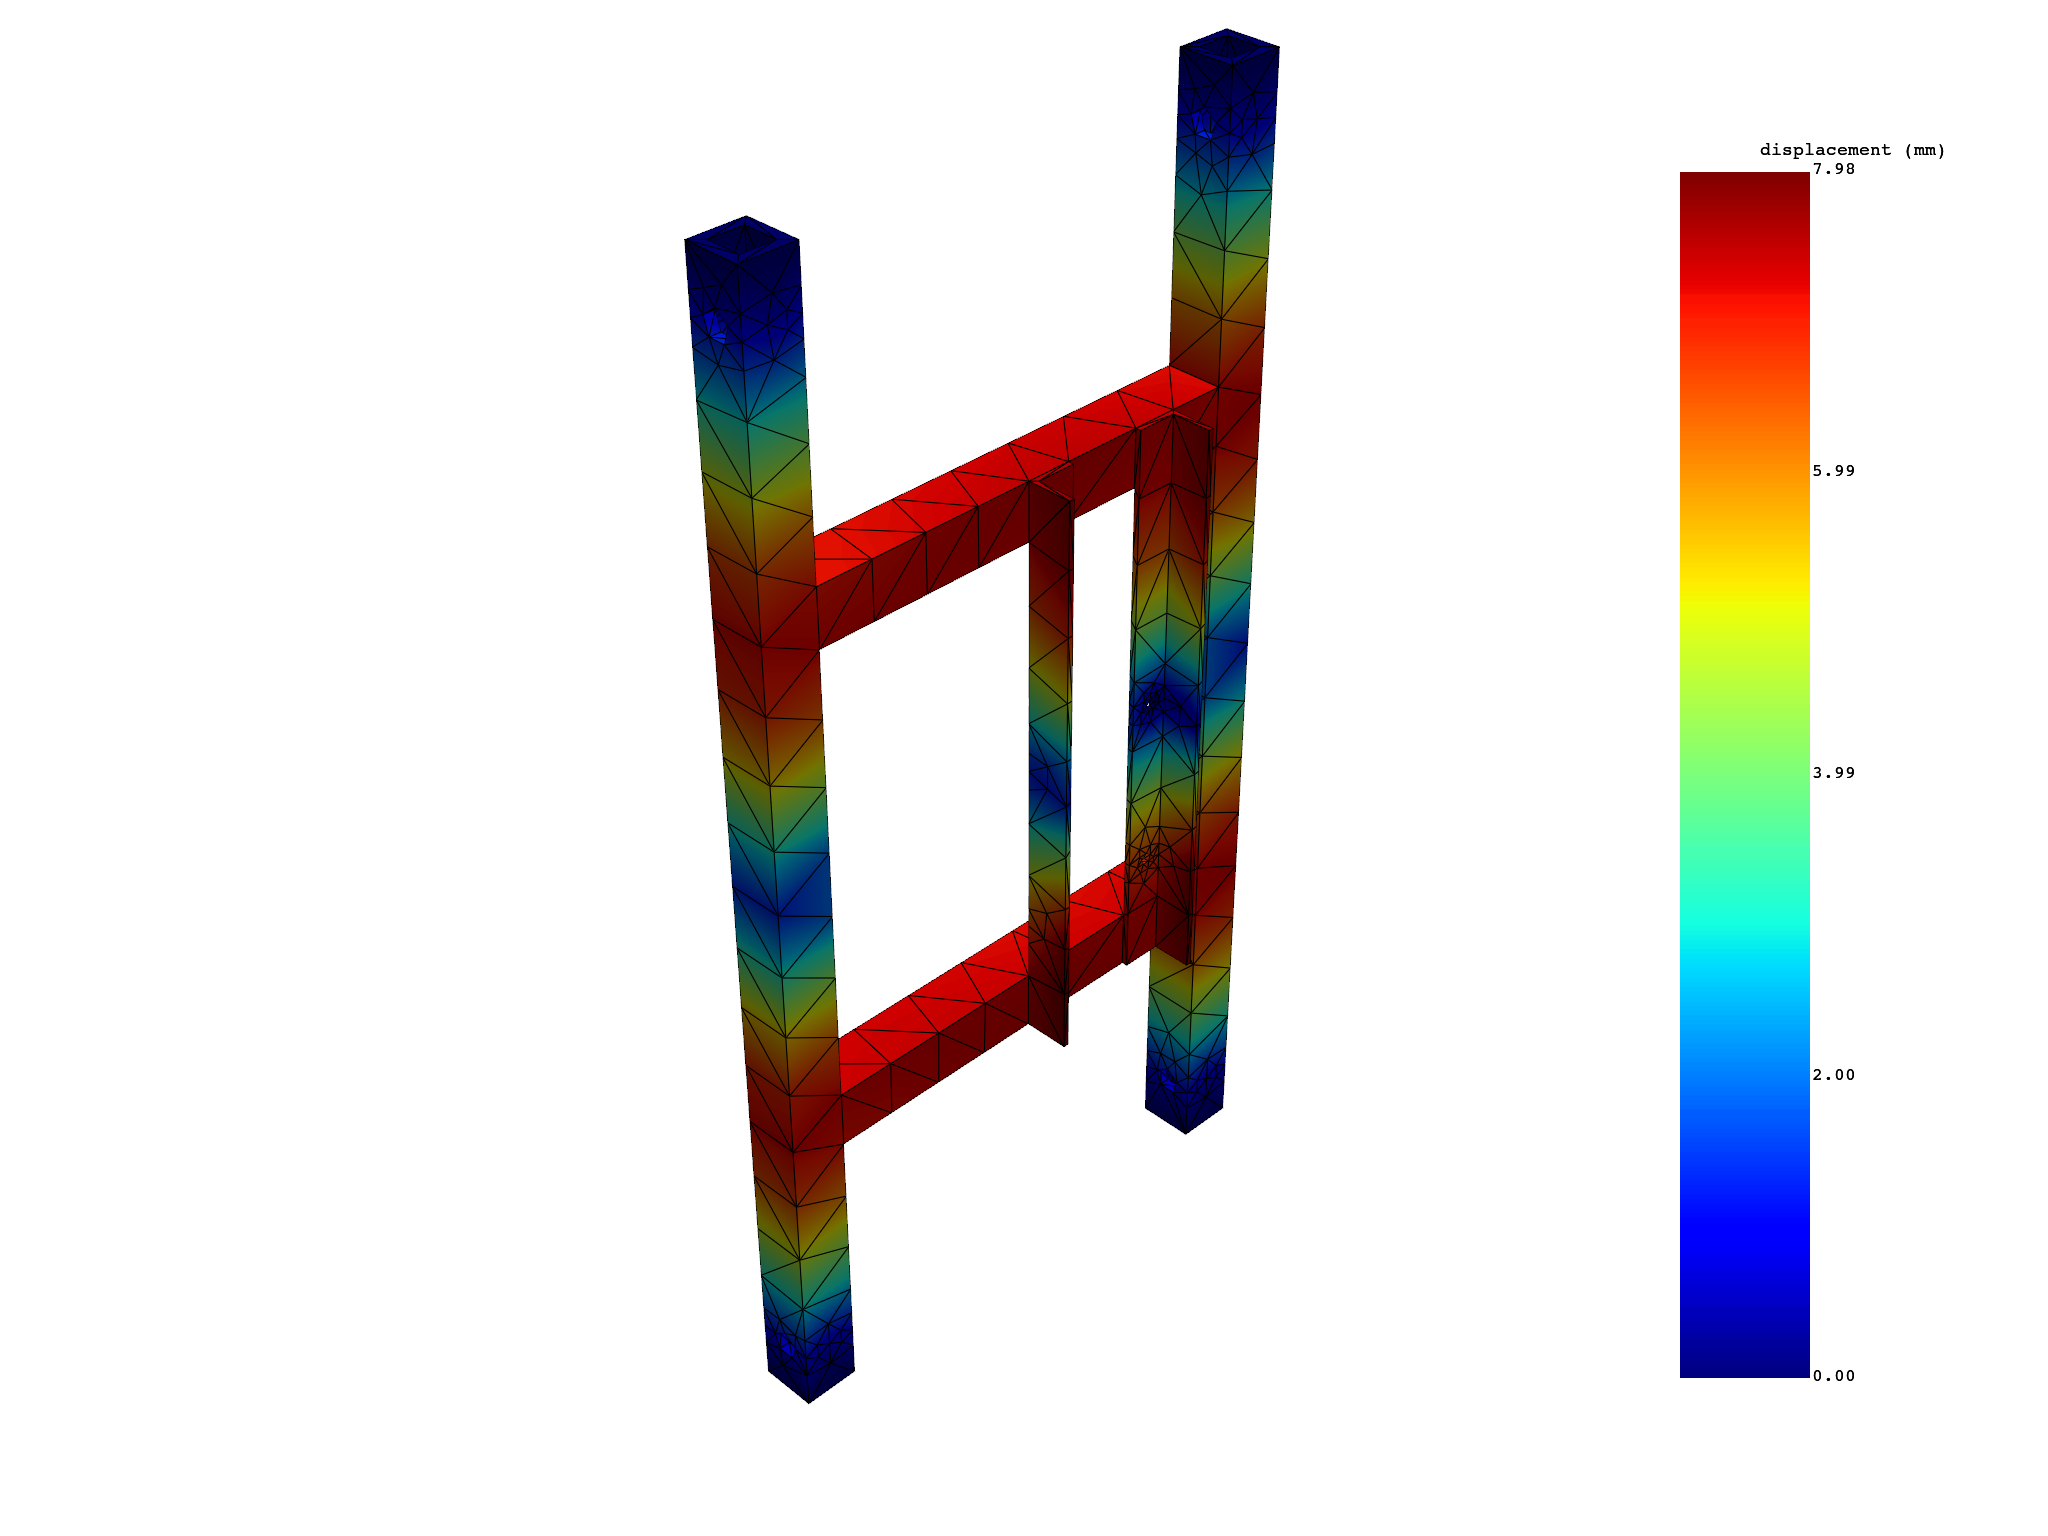
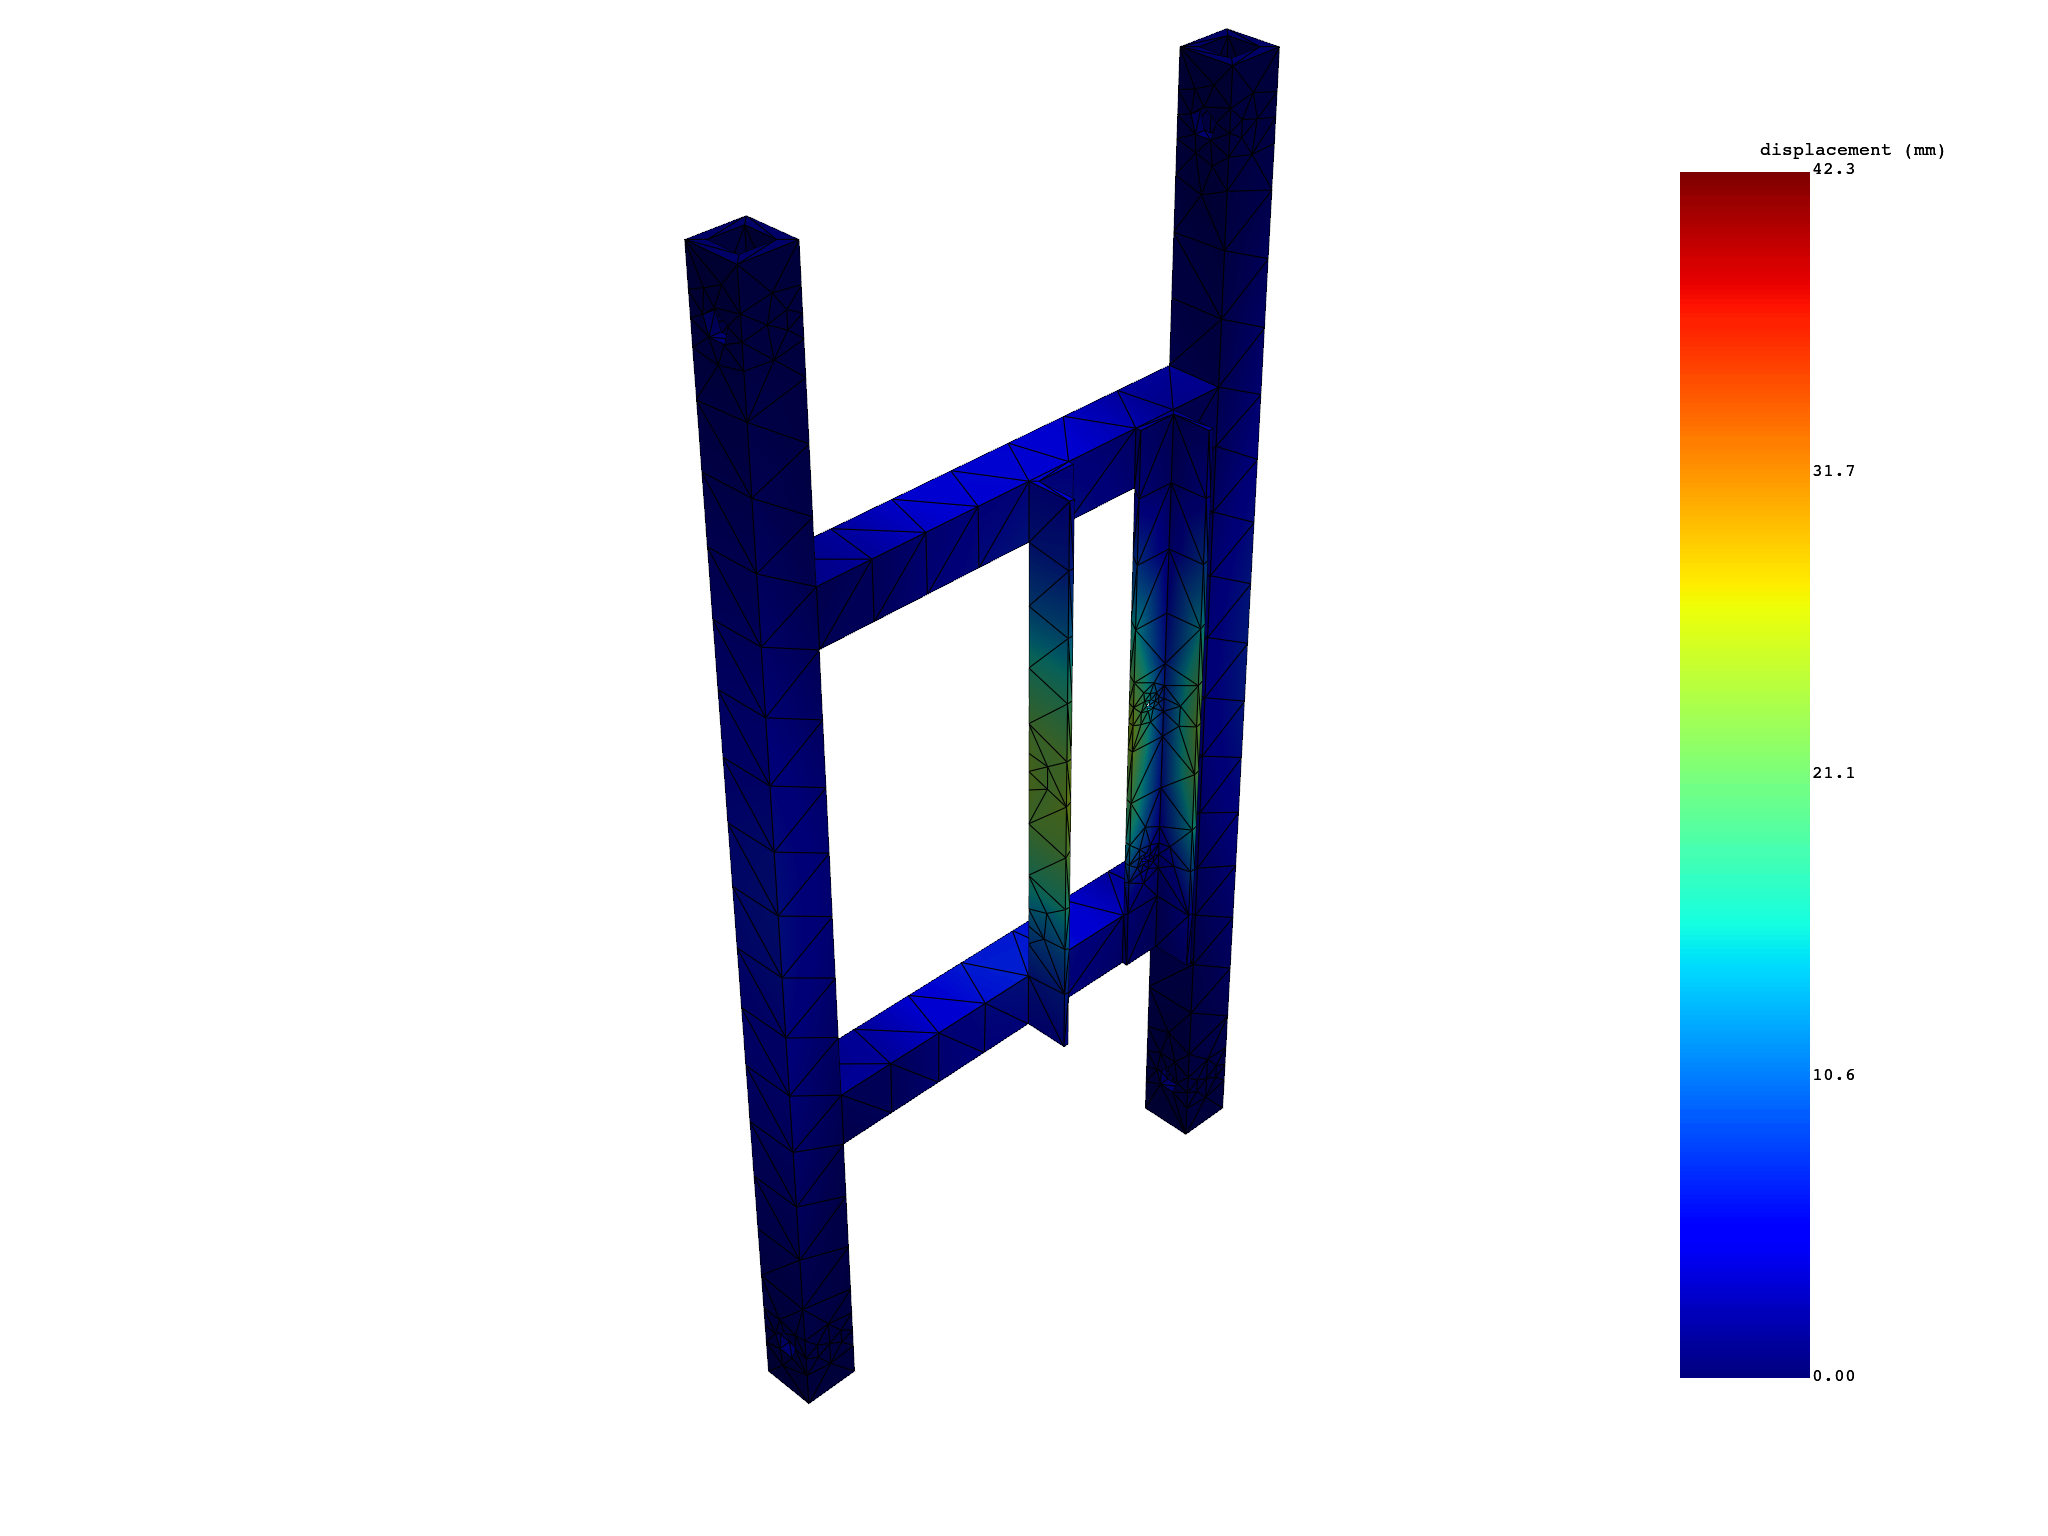
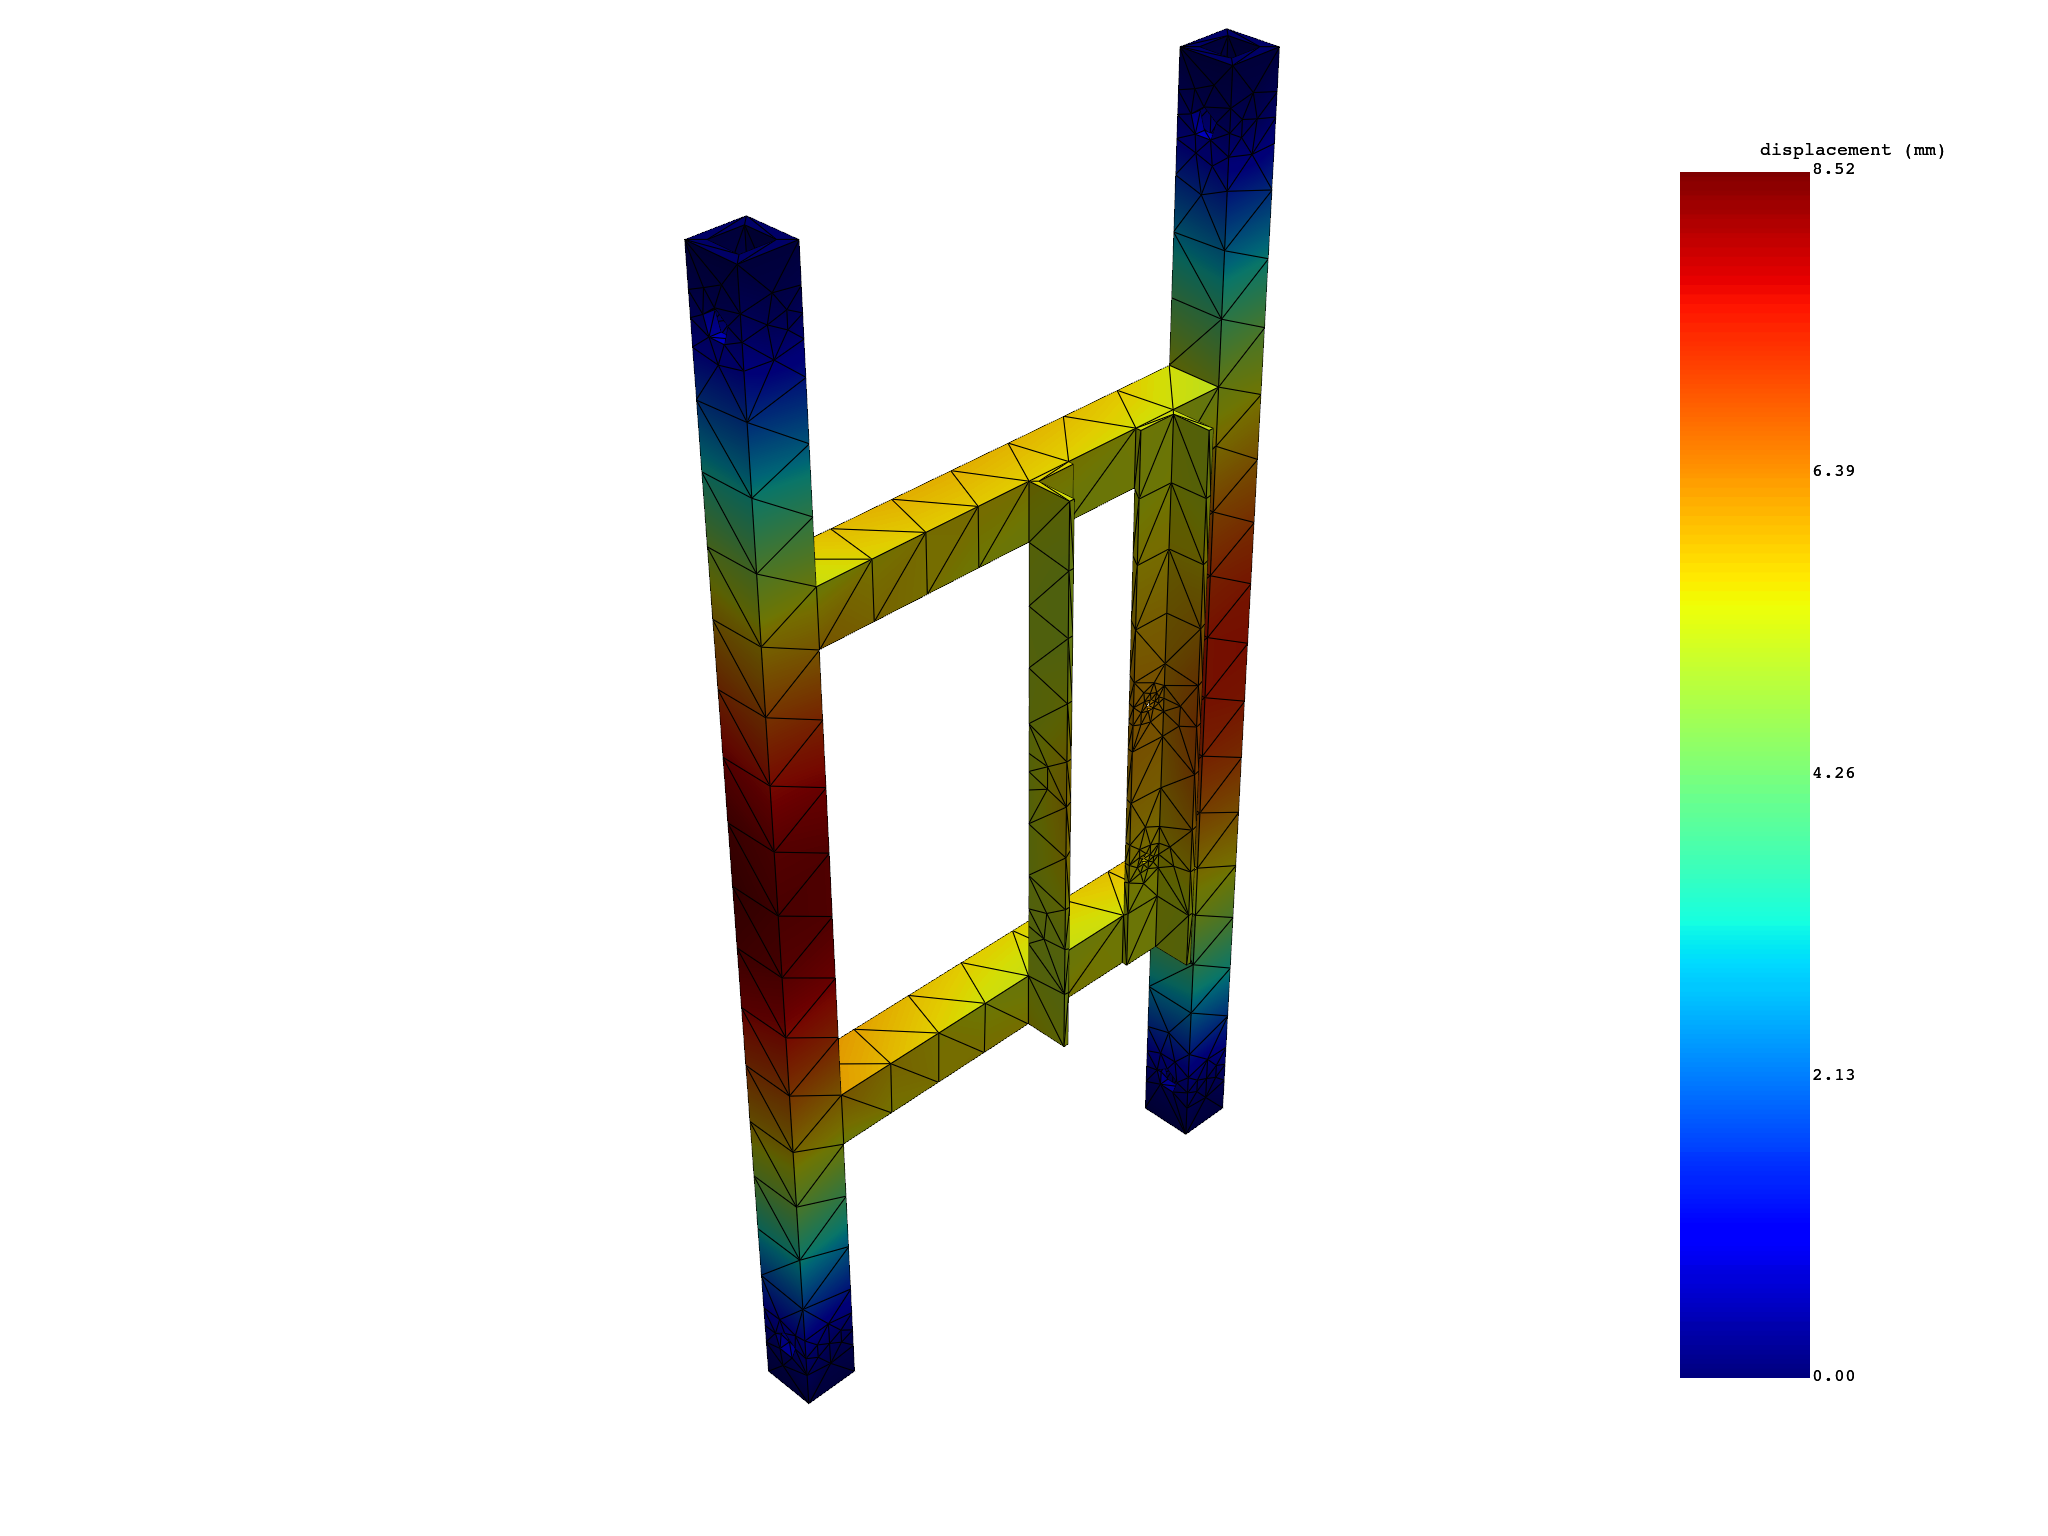
Extract and view a selection of mode shapes#
Extract and view a selection of mode shapes and view them one by one.

 results   U_N (mm)
 set_ids          1          2          3
node_ids
     367 1.3730e+00 1.8709e+00 2.0199e+00
     509 1.9036e+00 2.5893e+00 2.5942e+00
     428 1.0166e+00 1.4147e+00 1.5069e+00
     510 1.0461e+00 1.4141e+00 1.4841e+00
    3442 1.6226e+00 2.2226e+00 2.2954e+00
    3755 1.4089e+00 1.9743e+00 1.9950e+00
     ...        ...        ...        ...
Total running time of the script: (0 minutes 4.756 seconds)