Note
Go to the end to download the full example code.
Create and manipulate a DPF dataframe#
This example shows how to generate a dataframe by extracting a result from a static simulation. It also shows different dataframe viewing and manipulation possibilities.
Perform required imports#
Perform required imports. This example uses a supplied file that you can
get by importing the DPF examples package.
from ansys.dpf import post
from ansys.dpf.post import examples
Get the Simulation object#
Get the Simulation object that allows access to the result. The Simulation
object must be instantiated with the path for the result file. For example,
"C:/Users/user/my_result.rst" on Windows or "/home/user/my_result.rst"
on Linux.
example_path = examples.download_crankshaft()
# to automatically detect the simulation type, use:
simulation = post.load_simulation(example_path)

# to enable auto-completion, use the equivalent:
simulation = post.StaticMechanicalSimulation(example_path)

# print the simulation to get an overview of what's available
print(simulation)
Static Mechanical Simulation.


Data Sources
------------------------------
/opt/hostedtoolcache/Python/3.10.19/x64/lib/python3.10/site-packages/ansys/dpf/core/examples/result_files/crankshaft/crankshaft.rst

DPF Model
------------------------------
Static analysis
Unit system: MKS: m, kg, N, s, V, A, degC
Physics Type: Mechanical
Available results:
     -  node_orientations: Nodal Node Euler Angles
     -  displacement: Nodal Displacement
     -  velocity: Nodal Velocity
     -  acceleration: Nodal Acceleration
     -  reaction_force: Nodal Force
     -  stress: ElementalNodal Stress
     -  elemental_volume: Elemental Volume
     -  stiffness_matrix_energy: Elemental Energy-stiffness matrix
     -  artificial_hourglass_energy: Elemental Hourglass Energy
     -  kinetic_energy: Elemental Kinetic Energy
     -  co_energy: Elemental co-energy
     -  incremental_energy: Elemental incremental energy
     -  thermal_dissipation_energy: Elemental thermal dissipation energy
     -  elastic_strain: ElementalNodal Strain
     -  elastic_strain_eqv: ElementalNodal Strain eqv
     -  element_orientations: ElementalNodal Element Euler Angles
     -  structural_temperature: ElementalNodal Structural temperature
------------------------------
DPF  Meshed Region:
  69762 nodes
  39315 elements
  Unit: m
  With solid (3D) elements
------------------------------
DPF  Time/Freq Support:
  Number of sets: 3
Cumulative     Time (s)       LoadStep       Substep
1              1.000000       1              1
2              2.000000       1              2
3              3.000000       1              3
Get a Dataframe object#
Extract a result as a dataframe.
displacement_dataframe = simulation.displacement(all_sets=True)

# The dataframe is displayed as a table, with row and column labels to identify the data.
print(displacement_dataframe)
            results       U (m)
            set_ids           1           2           3
node_ids components
    4872          X  5.6781e-06 -5.9469e-06 -3.4137e-05
                  Y  5.1667e-04  1.0318e-03  1.5417e-03
                  Z -3.2535e-06 -4.1346e-06 -2.6398e-06
    9005          X -2.6323e-06 -2.1432e-05 -5.5625e-05
                  Y  4.8445e-04  9.6717e-04  1.4448e-03
                  Z -4.9795e-07  1.2790e-06  5.3134e-06
     ...        ...         ...         ...         ...
Explore Index objects#
The data labels are each defined by an Index object or one of its specialized subtypes.
# The dataframe's column labels are defined in ``Dataframe.columns```.
print(displacement_dataframe.columns)
MultiIndex<[ResultIndex<['U (m)']>, SetIndex<values=[1, 2, 3]>]>
A ResultIndex index defines the result stored in the dataframe.
print(displacement_dataframe.columns[0])
# print(displacement_dataframe.columns.results_index)  # equivalent
ResultsIndex "results" with 1 values of <class 'str'> type
You can check values available for an index.
print(displacement_dataframe.columns[0].values)
['U (m)']
A SetIndex index defines the available set IDs available.
A set ID is a unique identifier associated to each time-step, step and substep, or frequency
available in a simulation.
As shown next, an index has a name and a list of values of a given type.
print(displacement_dataframe.columns[1])
print(displacement_dataframe.columns[1].values)
SetIndex "set_ids" with 3 values of <class 'int'> type
[1, 2, 3]
The dataframe’s row labels are defined in dataframe.index.
print(displacement_dataframe.index)
MultiIndex<[MeshIndex<name="node_ids", dtype=<class 'int'>>, CompIndex<name="components", dtype=<class 'str'>>]>
A MeshIndex defines the mesh entities that data is available for.
It can store node IDs, element IDs, or face IDs.
print(displacement_dataframe.index[0])
# print(displacement_dataframe.index.mesh_index)  # equivalent
MeshIndex "node_ids" with uncounted values of <class 'int'> type
Because the list of possible values can be long and querying it can be costly, the list of available values might not be determined unless explicitly asked.
print(displacement_dataframe.index[0].values)
[ 4872 9005 9373 ... 34314 19123 19114]
The MeshIndex is then updated to display the actual number of entities available.
print(displacement_dataframe.index[0])
# IMPORTANT: Note that the mesh entity IDs ordered based on the internal data storage structure,
# they are not by ascending order by default!
MeshIndex "node_ids" with 69762 values of <class 'int'> type
A CompIndex defines the result components that data is available for.
print(displacement_dataframe.index[1])
print(displacement_dataframe.index[1].values)
CompIndex "components" with 3 values of <class 'str'> type
['X', 'Y', 'Z']
Change the dataframe print#
Options exist to configure the way a dataframe is shown. You can change the number of data rows shown:
displacement_dataframe.display_max_rows = 9
print(displacement_dataframe)
            results       U (m)
            set_ids           1           2           3
node_ids components
    4872          X  5.6781e-06 -5.9469e-06 -3.4137e-05
                  Y  5.1667e-04  1.0318e-03  1.5417e-03
                  Z -3.2535e-06 -4.1346e-06 -2.6398e-06
    9005          X -2.6323e-06 -2.1432e-05 -5.5625e-05
                  Y  4.8445e-04  9.6717e-04  1.4448e-03
                  Z -4.9795e-07  1.2790e-06  5.3134e-06
    9373          X -2.6475e-05 -6.9632e-05 -1.2845e-04
                  Y  4.9502e-04  9.8751e-04  1.4741e-03
                  Z  6.9526e-06  1.6184e-05  2.7631e-05
     ...        ...         ...         ...         ...
You can change the number of data columns shown:
displacement_dataframe.display_max_columns = 2
print(displacement_dataframe)
# Notice that the ``...`` symbols specify that the Dataframe is truncated in that direction.
            results       U (m)             ...
            set_ids           1           2 ...
node_ids components                         ...
    4872          X  5.6781e-06 -5.9469e-06 ...
                  Y  5.1667e-04  1.0318e-03 ...
                  Z -3.2535e-06 -4.1346e-06 ...
    9005          X -2.6323e-06 -2.1432e-05 ...
                  Y  4.8445e-04  9.6717e-04 ...
                  Z -4.9795e-07  1.2790e-06 ...
    9373          X -2.6475e-05 -6.9632e-05 ...
                  Y  4.9502e-04  9.8751e-04 ...
                  Z  6.9526e-06  1.6184e-05 ...
     ...        ...         ...         ... ...
See node number in element’s connectivity#
When dealing with results located on each node of each element (which is known
as ElementalNodal results, an ElementNodeIndex index is added at creation
to specify the node number in the element’s connectivity.
stress = simulation.stress()
print(stress)
print(stress.columns[2])
                results      S (Pa)
                set_ids           3
                   node           0           1           2           3
 element_ids components
       18357         XX  4.6183e+06 -1.5497e+06 -1.8339e+06 -5.5596e+06
                     YY  5.9405e+07  4.6302e+07  1.2961e+08 -1.2675e+07
                     ZZ  2.2825e+07  4.1579e+07  1.4117e+08 -1.4662e+08
                     XY -3.5088e+05  2.7884e+07  1.5350e+08  1.6123e+08
                     YZ -5.9452e+08 -4.9103e+08 -5.1941e+08 -4.5894e+08
                     XZ  7.6945e+06  2.3978e+07  3.2925e+07 -2.2203e+07
         ...        ...         ...         ...         ...         ...

ElementNodeIndex "node" with 1 values of <class 'int'> type
Select data#
To select specific columns or rows, use the index names as arguments for the
DataFrame.select() method, which takes lists of values:
disp_X_1 = displacement_dataframe.select(
    set_ids=[1], node_ids=[4872, 9005], components=["X"]
)
print(disp_X_1)
            results       U (m)
            set_ids           1
node_ids components
    4872          X  5.6781e-06
    9005            -2.6323e-06
You can also select along an index using a zero-based position with the
Dataframe.iselect() method:
disp_Y_9005_3 = displacement_dataframe.iselect(
    set_ids=[2], node_ids=[1], components=[1]
)
print(disp_Y_9005_3)
            results      U (m)
            set_ids          3
node_ids components
    9005          Y 1.4448e-03
Extract data#
Once the dataframe contains the specific data you require, extract it as an array:
print(disp_X_1.array)
# IMPORTANT: Note that for the extraction of the Dataframe's data as an array to make sense,
# you must first filter the columns label values to a unique combination of values.
# The exception is for ElementalNodal data, which is returned as a 2D array.
print(stress.array.shape)
[ 5.67807472e-06 -2.63230351e-06]
(157260, 6)
Plot a dataframe#
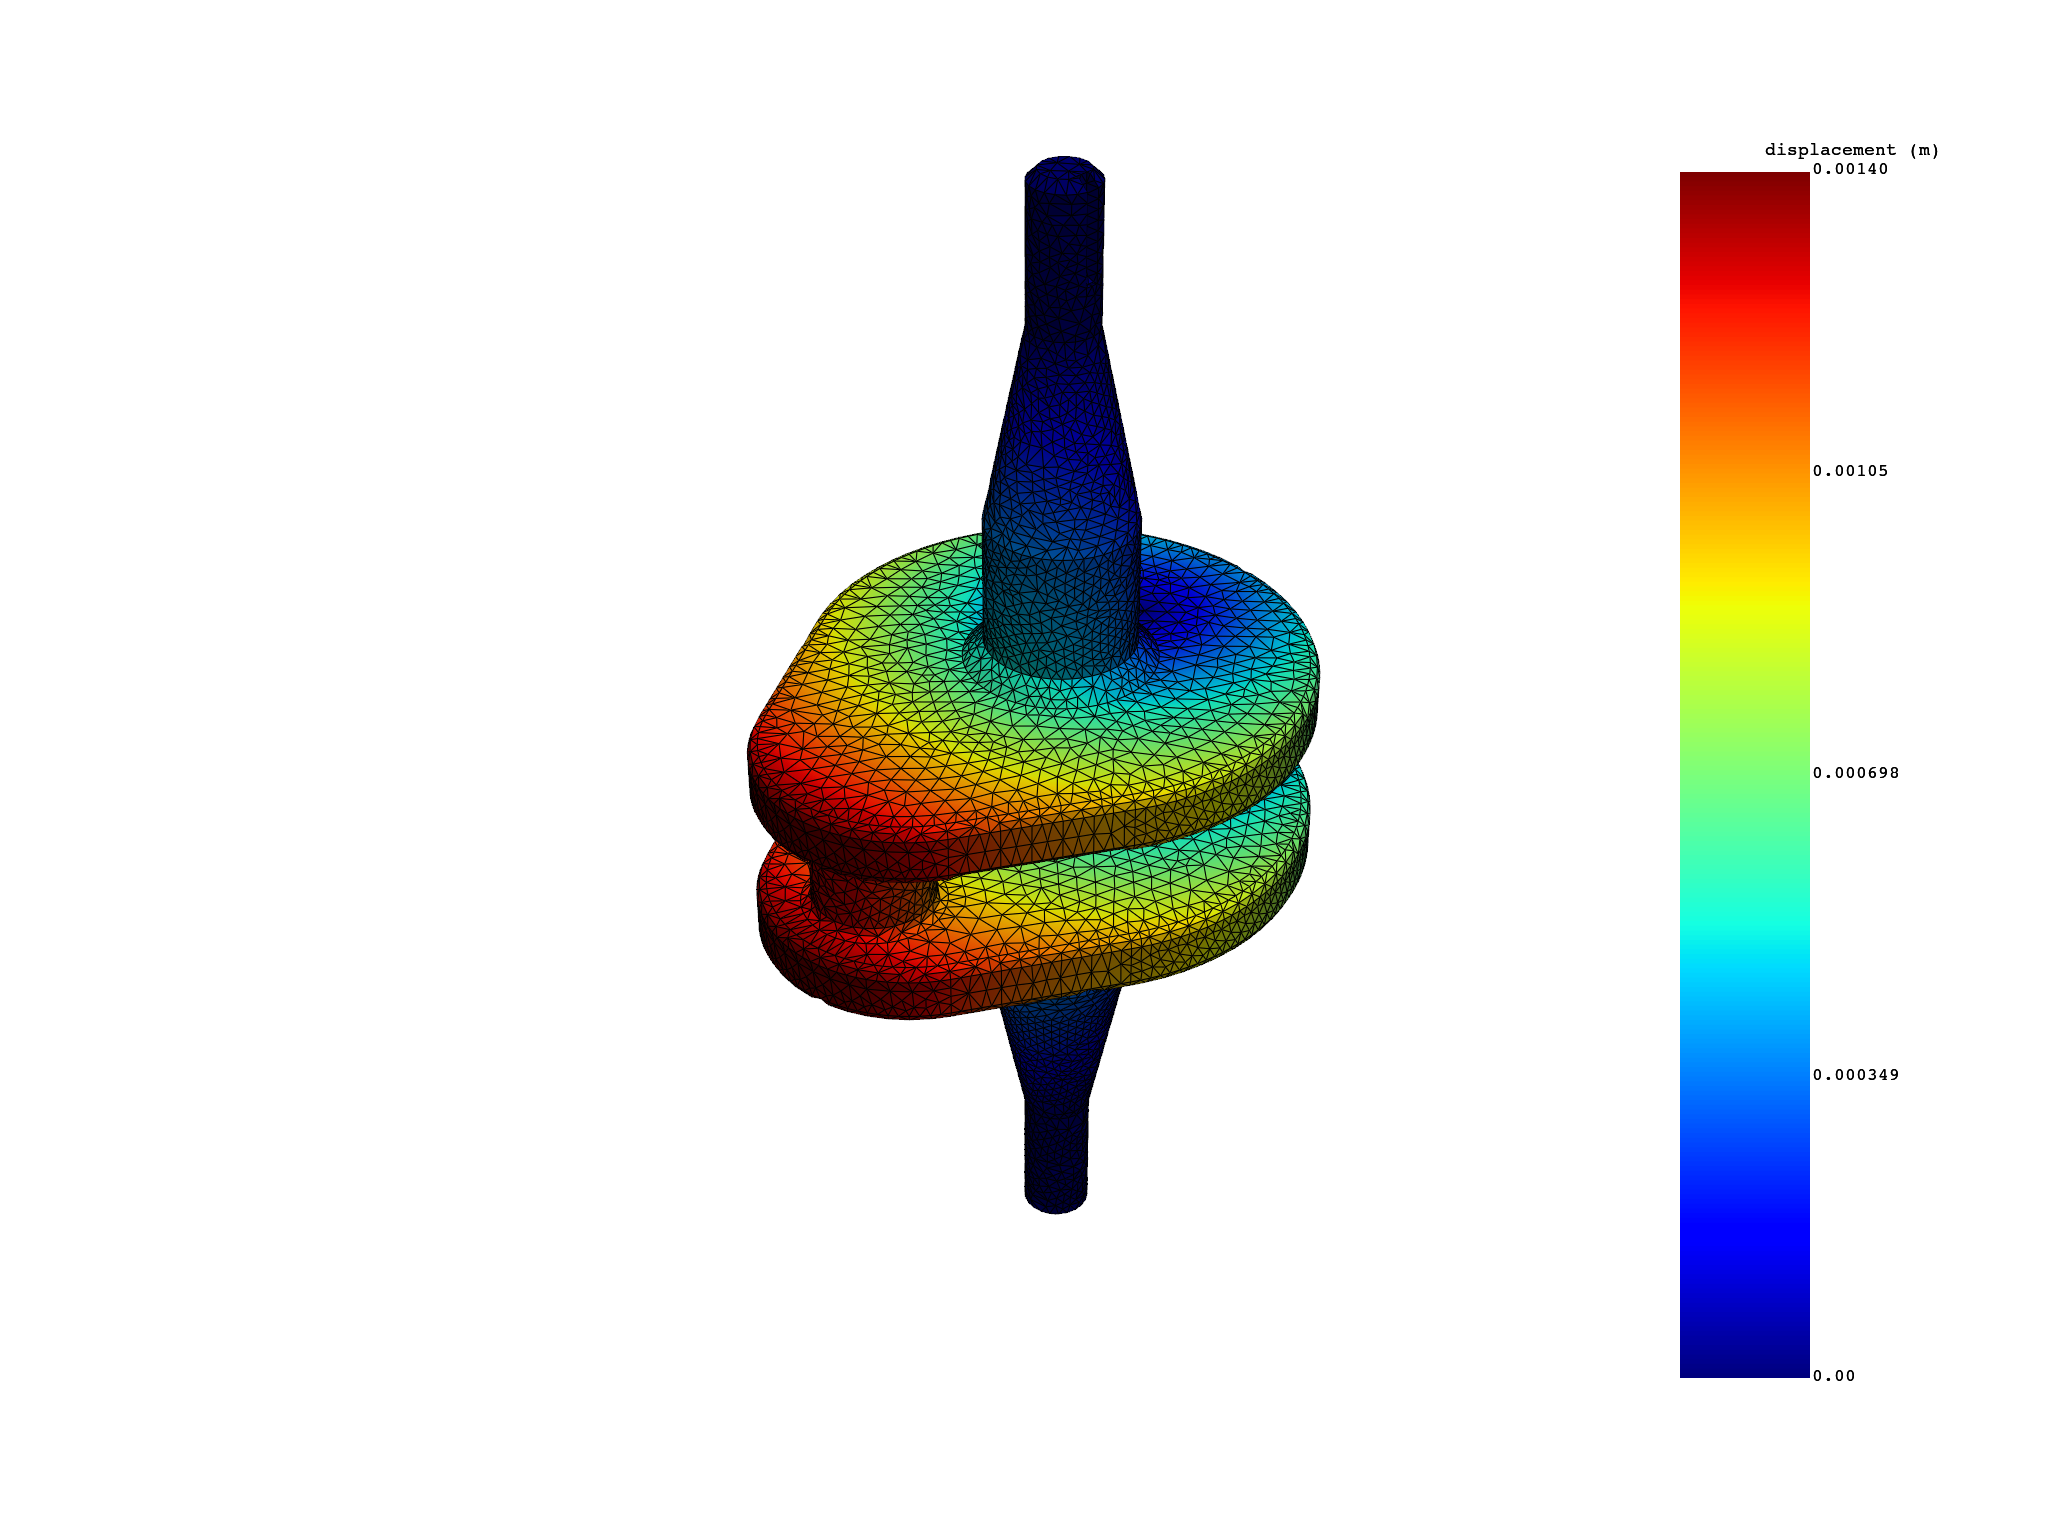
displacement_dataframe.plot()

(None, <pyvista.plotting.plotter.Plotter object at 0x7f7716612c50>)
Animate a transient dataframe#
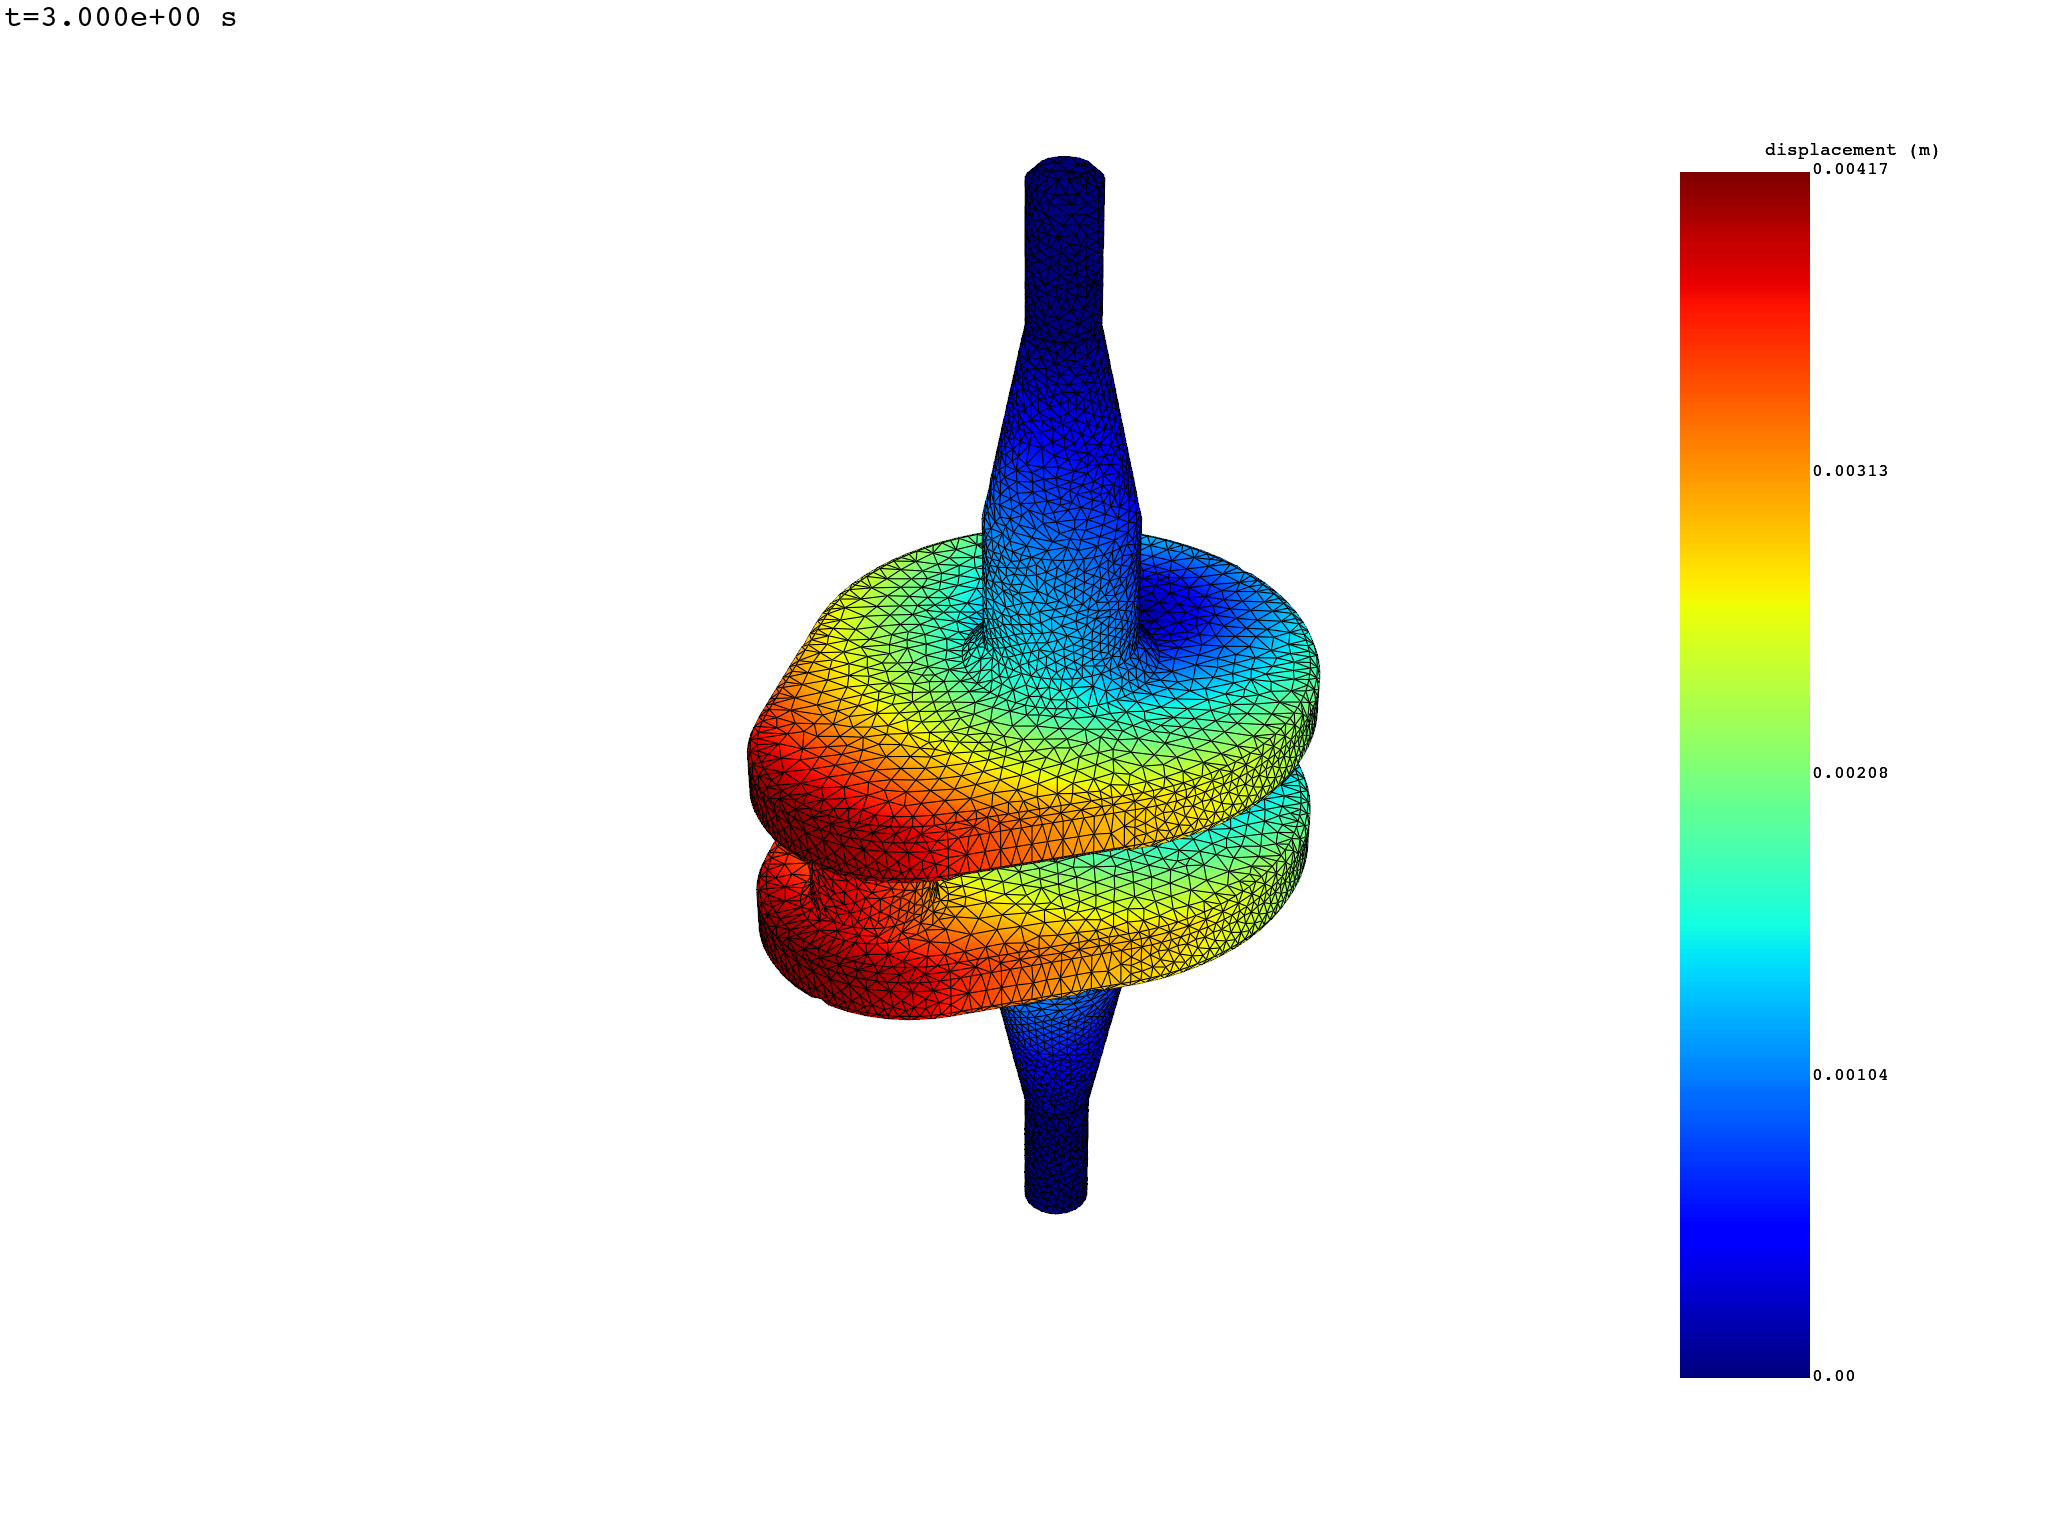
displacement_dataframe.animate()

Total running time of the script: (0 minutes 2.430 seconds)

