Note
Go to the end to download the full example code.
Explore the data of a result with the dataframe (harmonic simulation)#
This example uses a harmonic simulation to show how to interact with the PyDPF-Post dataframe, which is the object returned by each result.
Note
This example requires DPF 3.0 (2022 R1) or above. For more information, see PyDPF library compatibilities.
Perform required imports#
Perform required imports. This example uses a supplied file that you can
get by importing the DPF examples package.
from ansys.dpf import post
from ansys.dpf.post import examples
Get Simulation object#
Get the Simulation object that allows access to the result. The Simulation
object must be instantiated with the path for the result file. For example,
"C:/Users/user/my_result.rst" on Windows or "/home/user/my_result.rst"
on Linux.
example_path = examples.download_harmonic_clamped_pipe()
# to automatically detect the simulation type, use:
simulation = post.load_simulation(example_path)

# to enable auto-completion, use the equivalent:
simulation = post.HarmonicMechanicalSimulation(example_path)
Extract displacement over all sets#
displacement = simulation.displacement(all_sets=True)
print(displacement)
type(displacement)
            results           U                                                          ...
            set_ids           1                      2                      3            ...
            complex           0          1           0          1           0          1 ...
node_ids components                                                                      ...
    3548          X  9.3929e+01 0.0000e+00 -5.2330e+01 0.0000e+00 -1.1203e+01 0.0000e+00 ...
                  Y -4.3312e+02 0.0000e+00  1.8810e+02 0.0000e+00  6.8681e+01 0.0000e+00 ...
                  Z  9.6172e-01 0.0000e+00 -1.3049e+01 0.0000e+00  2.3508e+01 0.0000e+00 ...
    3656          X  1.0516e+02 0.0000e+00 -5.8461e+01 0.0000e+00 -1.4575e+01 0.0000e+00 ...
                  Y -4.6059e+02 0.0000e+00  2.0315e+02 0.0000e+00  7.4665e+01 0.0000e+00 ...
                  Z  9.4728e-01 0.0000e+00 -1.3728e+01 0.0000e+00  2.5207e+01 0.0000e+00 ...
     ...        ...         ...        ...         ...        ...         ...        ... ...
Loop over all columns and rows to understand the dataframe and get the values for each index.
# columns
for column in displacement.columns:
    print(f'Column with label "{column.name}" and available values {column.values}.')

# rows
for row in displacement.index:
    print(f'Row with label "{row.name}" and available values {row.values}.')
Column with label "results" and available values ['U'].
Column with label "set_ids" and available values [1, 2, 3, 4, 5].
Column with label "complex" and available values [0, 1].
Row with label "node_ids" and available values [3548 3656 4099 ... 3260 9942 9943].
Row with label "components" and available values ['X', 'Y', 'Z'].
Make selections in dataframe#
Use the labels and values shown by the preceding code to select subparts of the dataframe.
all_real_values = displacement.select(complex=0)
print(all_real_values)

all_imaginary_values = displacement.select(complex=1)
print(all_imaginary_values)

sets_values = displacement.select(set_ids=[1, 2])
print(sets_values)

node_values = displacement.select(node_ids=[3548])
print(node_values)
            results           U
            set_ids           1           2           3           4           5
            complex           0
node_ids components
    3548          X  9.3929e+01 -5.2330e+01 -1.1203e+01 -1.1510e+01 -1.4457e+01
                  Y -4.3312e+02  1.8810e+02  6.8681e+01  2.2900e+01 -6.6765e+00
                  Z  9.6172e-01 -1.3049e+01  2.3508e+01  1.4745e+00 -5.9568e+00
    3656          X  1.0516e+02 -5.8461e+01 -1.4575e+01 -1.3822e+01 -1.7782e+01
                  Y -4.6059e+02  2.0315e+02  7.4665e+01  2.7874e+01  1.5223e+00
                  Z  9.4728e-01 -1.3728e+01  2.5207e+01  1.4487e+00 -7.3947e+00
     ...        ...         ...         ...         ...         ...         ...


            results          U
            set_ids          1          2          3          4          5
            complex          1
node_ids components
    3548          X 0.0000e+00 0.0000e+00 0.0000e+00 0.0000e+00 0.0000e+00
                  Y 0.0000e+00 0.0000e+00 0.0000e+00 0.0000e+00 0.0000e+00
                  Z 0.0000e+00 0.0000e+00 0.0000e+00 0.0000e+00 0.0000e+00
    3656          X 0.0000e+00 0.0000e+00 0.0000e+00 0.0000e+00 0.0000e+00
                  Y 0.0000e+00 0.0000e+00 0.0000e+00 0.0000e+00 0.0000e+00
                  Z 0.0000e+00 0.0000e+00 0.0000e+00 0.0000e+00 0.0000e+00
     ...        ...        ...        ...        ...        ...        ...


            results           U
            set_ids           1                      2
            complex           0          1           0          1
node_ids components
    3548          X  9.3929e+01 0.0000e+00 -5.2330e+01 0.0000e+00
                  Y -4.3312e+02 0.0000e+00  1.8810e+02 0.0000e+00
                  Z  9.6172e-01 0.0000e+00 -1.3049e+01 0.0000e+00
    3656          X  1.0516e+02 0.0000e+00 -5.8461e+01 0.0000e+00
                  Y -4.6059e+02 0.0000e+00  2.0315e+02 0.0000e+00
                  Z  9.4728e-01 0.0000e+00 -1.3728e+01 0.0000e+00
     ...        ...         ...        ...         ...        ...


            results           U                                                          ...
            set_ids           1                      2                      3            ...
            complex           0          1           0          1           0          1 ...
node_ids components                                                                      ...
    3548          X  9.3929e+01 0.0000e+00 -5.2330e+01 0.0000e+00 -1.1203e+01 0.0000e+00 ...
                  Y -4.3312e+02 0.0000e+00  1.8810e+02 0.0000e+00  6.8681e+01 0.0000e+00 ...
                  Z  9.6172e-01 0.0000e+00 -1.3049e+01 0.0000e+00  2.3508e+01 0.0000e+00 ...
Make selections in dataframe by index#
To select values by index for each label, use the iselect() method.
The index to ID order follows what is returned by the values on the preceding index method.
sets_values = displacement.iselect(set_ids=0)
print(sets_values)

node_values = displacement.iselect(node_ids=[0])
print(node_values)
            results           U
            set_ids           1
            complex           0          1
node_ids components
    3548          X  9.3929e+01 0.0000e+00
                  Y -4.3312e+02 0.0000e+00
                  Z  9.6172e-01 0.0000e+00
    3656          X  1.0516e+02 0.0000e+00
                  Y -4.6059e+02 0.0000e+00
                  Z  9.4728e-01 0.0000e+00
     ...        ...         ...        ...


            results           U                                                          ...
            set_ids           1                      2                      3            ...
            complex           0          1           0          1           0          1 ...
node_ids components                                                                      ...
    3548          X  9.3929e+01 0.0000e+00 -5.2330e+01 0.0000e+00 -1.1203e+01 0.0000e+00 ...
                  Y -4.3312e+02 0.0000e+00  1.8810e+02 0.0000e+00  6.8681e+01 0.0000e+00 ...
                  Z  9.6172e-01 0.0000e+00 -1.3049e+01 0.0000e+00  2.3508e+01 0.0000e+00 ...
Make multiple selections in dataframe#
real_values_for_one_set_onde_node = displacement.select(
    node_ids=[3548], set_ids=1, complex=0
)
print(real_values_for_one_set_onde_node)
            results           U
            set_ids           1
            complex           0
node_ids components
    3548          X  9.3929e+01
                  Y -4.3312e+02
                  Z  9.6172e-01
Make selections to plot dataframe#
displacement.plot(set_ids=1, complex=0)
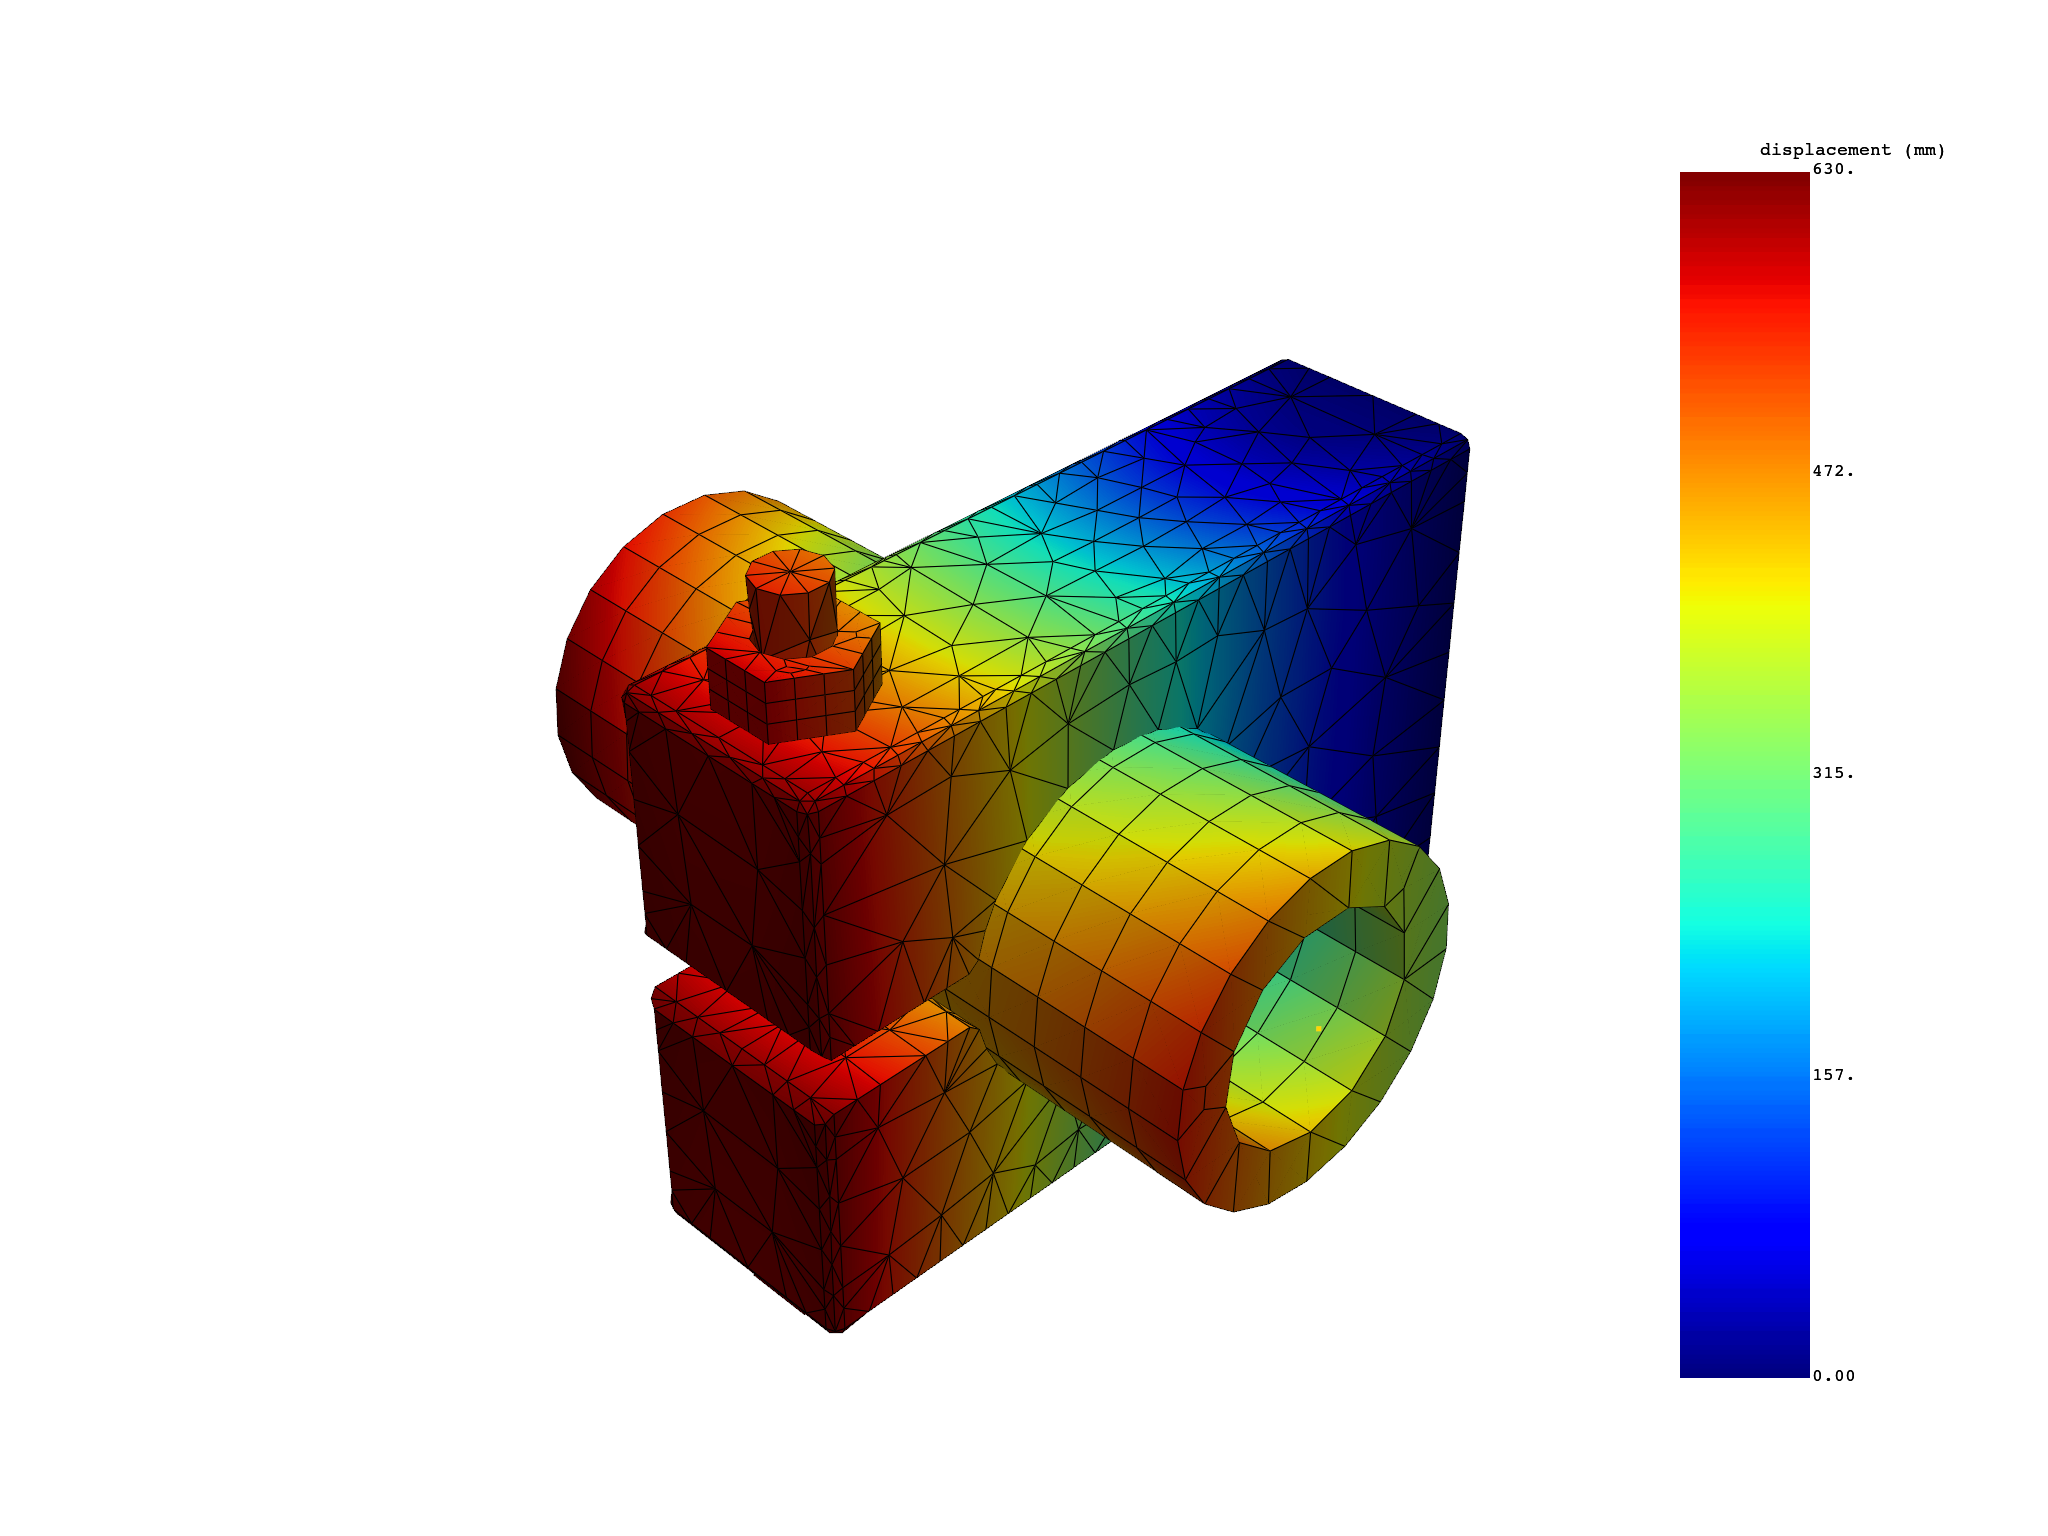
(None, <pyvista.plotting.plotter.Plotter object at 0x7f2cd395bb80>)
Total running time of the script: (0 minutes 0.623 seconds)